After last night’s analysis that the stock market suffered some losses, but not a lethal blow, it dutifully rallied today.
That said, the Transportation Sector ETF (IYT), Regional Banks ETF (KRE), Biotechnology Sector ETF (IBB) and Retail Sector ETF (XRT) all remain in caution phases.
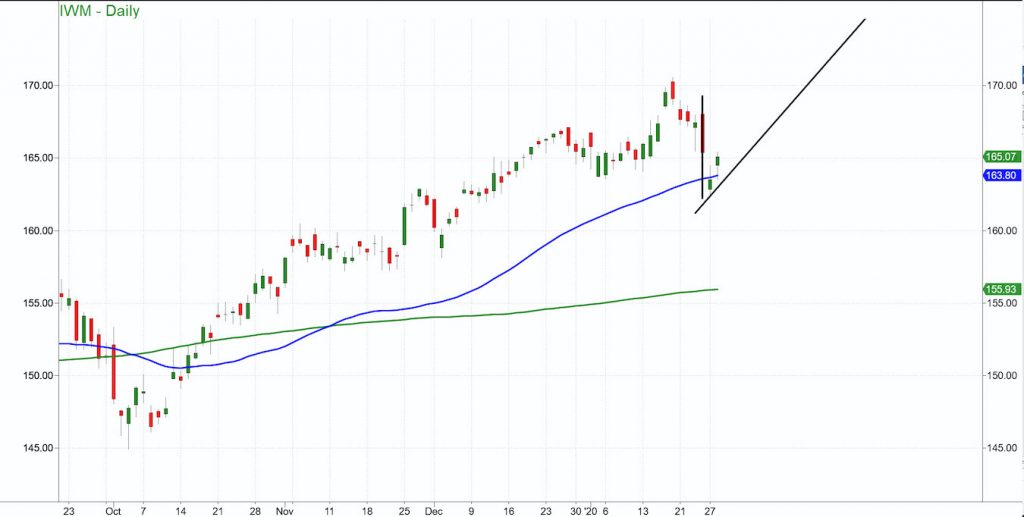
The Russell 2000 Index moved back above the 50-day moving average and into a bullish phase. Therefore, we ask:
Was that the V-bottom we have enjoyed throughout most corrections, or a bear flag and the start of much nastier downturn coming soon?
The Russell 2000 cleared back over the 50-daily moving average or 163.81.
And although XRT, KRE, IBB, and IYT could not clear their 50-day moving averages, they all gained in price today.
Since we like to use the economic Modern Family and their investing phases to measure market breadth, today was good… but not necessarily the “out of the woods” day bulls hope for.
So, going into midweek, investors should watch to see if the Russell 2000 holds above the 164 level and clears 165.40 next.
Otherwise, with 4 of our core 6 ETFs in caution phases, assume that if Russell 2000 cannot hold, we could be looking at a move down to 160 next.
Stock Market ETFs Price Analysis:
S&P 500 (SPY) A weekly close under 320 will not look healthy. 329.50 resistance
Russell 2000 (IWM) price support between 163.80-164.07 needs to hold.
Dow Jones Industrials (DIA) 284.12 is the 50-day moving average with 290.35 resistance.
Nasdaq (QQQ) 212.24 is price support with 222 price resistance.
KRE (Regional Banks) 54.00 is the 200-day moving average. 56.55 is price resistance
SMH (Semiconductors) Major price support is at 139.77. Price resistance is at 145.65
IYT (Transportation) 190 is next price support, while 195.50 is resistance.
IBB (Biotechnology) 115.40 is price support, while 119 is resistance.
XRT (Retail) 43 is price support and 45.00 is resistance.
Volatility Index (VXX) If 14.55 holds, then that could also mean more selling in store.
Twitter: @marketminute
The author may have a position in the mentioned securities at the time of publication. Any opinions expressed herein are solely those of the author, and do not in any way represent the views or opinions of any other person or entity.

 Flirting With Critical Support… Again")


