The Grandaddy Russell 2000 rallied close to its 200-week moving average (topic of yesterday’s article) yesterday.
Wednesday, with rising yields once again, Gramps retreated.
In a bullish scenario, IWM continues to consolidate and rally in the coming days and weeks, eventually breaking through the 200-week moving average and continuing to climb.
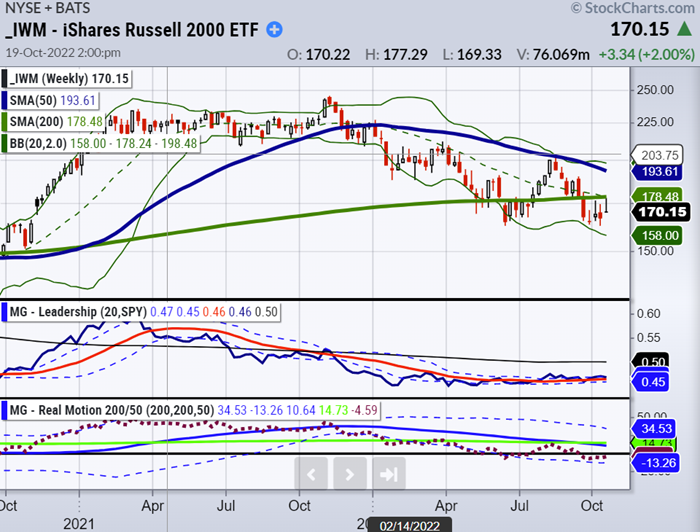
In the bearish case, if IWM cannot regain its 200-WMA after a period of consolidation, this key weekly technical level will become significant bear market resistance.
That will most likely lead to lower lows.
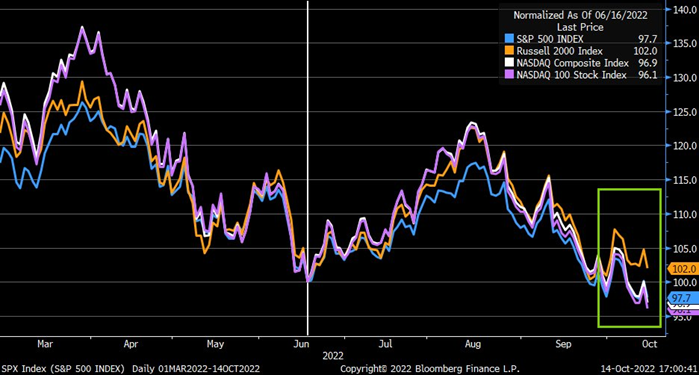
IWM is in a bearish phase along with the other indices, but recent price action has shown relative strength.
What should we watch out for?
While IWM struggles to break above its 200-week moving average, it has held its mid-June lows.
SPY, DIA, and Nasdaq 100, all failed to do so.
Grandpa Russell’s companies are mid-cap and small-cap American businesses that are less well-known brands and have little exposure to international markets, so the strong US dollar has less impact.
The Russell 2000 has violated the 200-weekly moving average several times before. In fact, with every crisis it was the NASDAQ that led while small caps remained weak.
The reasons for that were low interest rates, low corporate tax rates and corporate buybacks. Small cap companies did not have the same benefits from those factors.
In fact, this highlights the recent resilience of small and mid-cap stocks compared to large-cap stocks in the face of inflation, higher rates, slowing economic growth, and US dollar strength.
Grandpa Russell still needs substantial work to the upside, but a potential multi-week bottom might be forming.
Are you interested in trading small caps? Keep up to date with our analysis so you can enter and exit trades at the right time.
Mish’s Upcoming Seminars:
The Money Show, October 30 – November 1
Our members get 20% off the registration price!
Join Mish and many wonderful speakers at the Money Show in Orlando beginning October 30th running thru November 1st. Spend Halloween with us! Use either link to join Mish there!
Stock Market ETFs Trading Analysis & Summary:
S&P 500 (SPY) 360 pivotal support and resistance at 380.
362 caution; 360, 351, 340 upside: 375, 380, 385
Russell 2000 (IWM) 168 support and 173 support
Dow Jones (DIA) Continuing to hold 299 support; 308 resistance
Nasdaq (QQQ) 267 support and 274 resistance
Regional banks (KRE) 60 support and 64 resistance
Semiconductors (SMH) support at 175 and resistance at 182
Transportation (IYT) support at 202 with 208-210 resistance
Biotechnology (IBB) 115 support and 122 resistance
Retail (XRT) long-term support at 55 and resistance at 62
Twitter: @marketminute
The author may have a position in mentioned securities at the time of publication. Any opinions expressed herein are solely those of the author and do not represent the views or opinions of any other person or entity.


