Earlier this morning, several traders (including myself) noted that the Russell 2000 bounce was lagging other major equity indices. Why would this be important? The Russell 2000 Index (RUT) tends to be a good gauge of investor risk appetite because it is comprised of small cap stocks, which tend to be more sensitive to directional moves. For instance, if large caps stocks are outperforming small cap stocks, it could mean that investors aren’t fully committing capital to other risk asset classes (and perhaps aren’t fully believing in the day’s move).
BUT, as the day wore on, the small caps made up ground and showed some strength into the closing bell, with the Russell 2000 ending the day up 1.26% (in line with other major indices). This doesn’t mean that a bottom is in by any means, but it does give the rally a better chance of carrying over into tomorrow. Remember, the RUT was down 5 days in a row, so traders will want to see more evidence (i.e. follow through).
With any bounce, the next step is to identify resistance to see if the markets have enough strength to turn a bounce into something more. Or if they fail and turn back lower, continuing the downtrend.
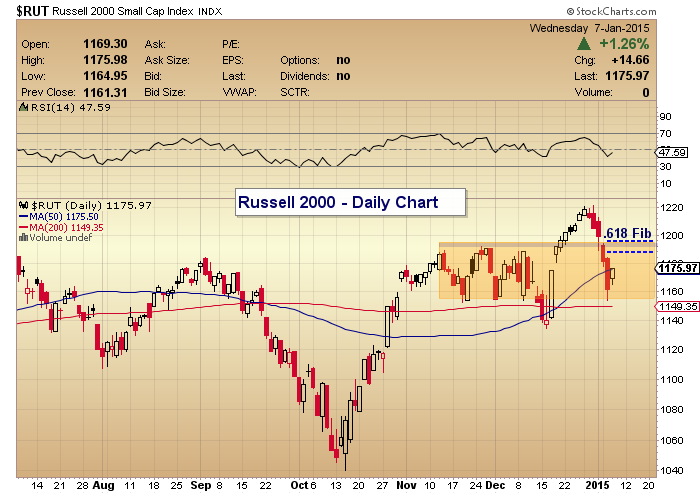
In the chart below, you can see the multi-day pullback on the Russell 2000. I’ve included a few resistance levels that I am using to gauge the relative strength/weakness of this bounce:
1. 1175 – This marks the 50 day moving average (50 dma). This is a very “general” macro technical tool. Note that the index closed today right at the 50 dma.
2. 1187 – This is the 50 percent Fibonacci retracement level of the 5 day down move.
3. 1192 – 1195 – This is the top of the shaded box. It represents the highs on Monday’s gap-down day. Note that 1195.4 is also the .618 Fibonacci retracement of the 5-day down move.
If the Russell 2000 and stocks in general are set to head lower near-term, I would expect this rally to fizzle into one of these resistance levels. On the flip side, if the Russell is going to test its highs again, it will need to close back above 1195.
Russell 2000 (RUT) – Daily Price Chart
Follow Andy on Twitter: @andrewnyquist
No position in any of the mentioned securities at the time of publication. Any opinions expressed herein are solely those of the author, and do not in any way represent the views or opinions of any other person or entity.


