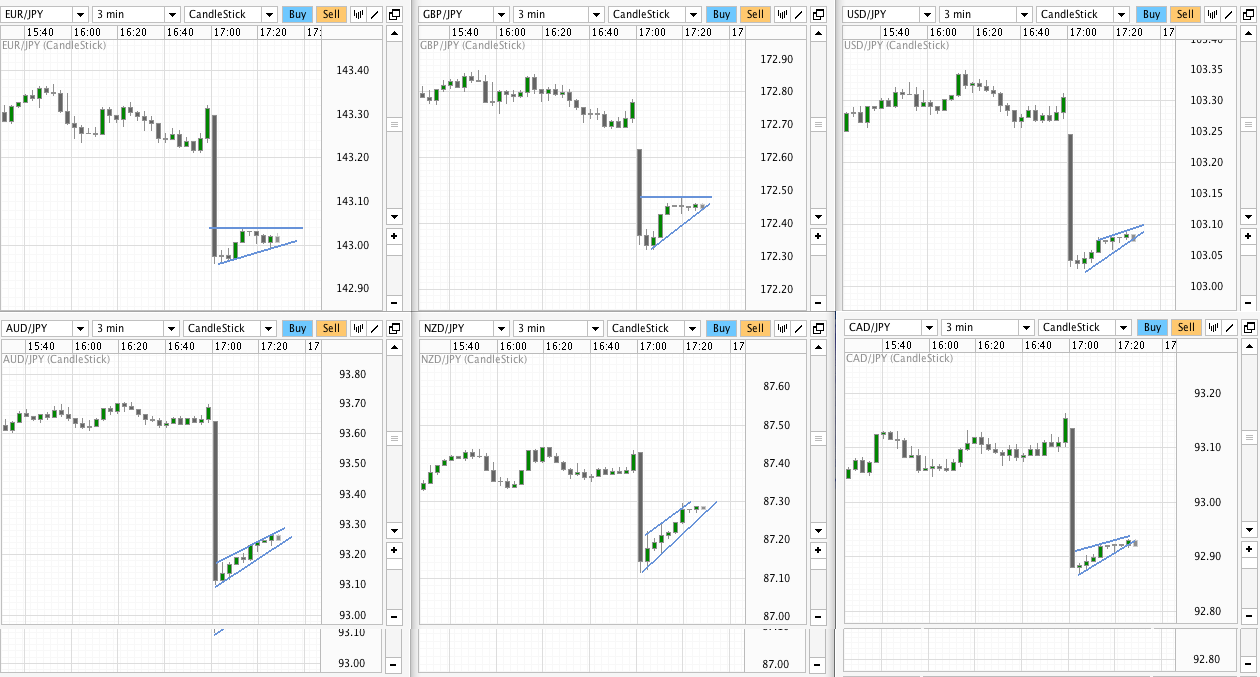
 Japanese Yen crosses opened trade in New Zealand and Sydney on Monday morning with a sharp opening drop, with AUD/JPY leading on a 50 pip drop to 93.10 before recovering modestly. Collectively regarded as a barometer of risk appetite because of the JPY’s safe haven status and their general popularity as a carry trade, flows into and out of the JPY in pairs such as EUR/JPY, USD/JPY and AUD/JPY often bear a high positive correlation with the rise and fall of benchmark equities indices such as Nikkei225, DAX and S&P 500.
JPY Cross Complex – 3-Minute Chart: Sunday Evening Opens Broadly Lower
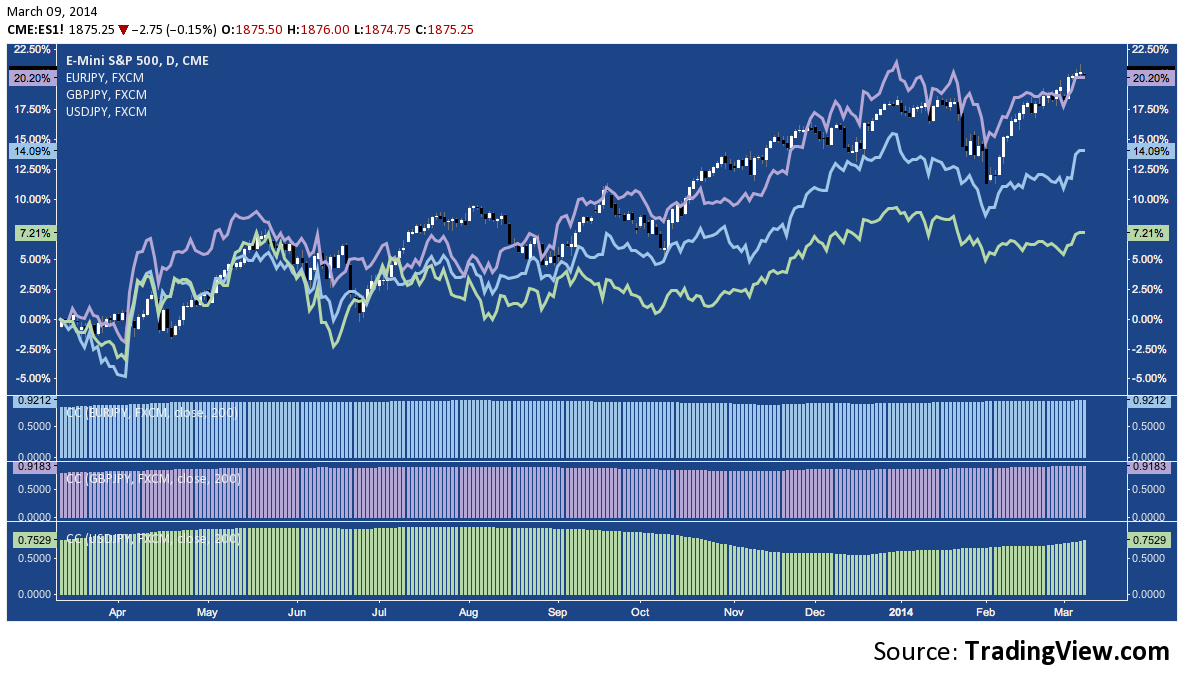
And here’s a glance at the positive correlation, comparing S&P Futures (ES) with EUR/JPY (blue) GBP/JPY (Purple) and USD/JPY (Light Green). In the right margin, the Y-axis features the appreciation these currencies have enjoyed v. the JPY over the last year; and in the lower panel, you’ll notice the coefficients – especially in the case of the first two pairs – run close to 1 over a 200-day lookback:
S&P Futures vis-a-vis JPY Crosses: ES and EUR/JPY, GBPJPY and USD/JPY
Opening Sunday evening (ET) volatility in the Interbank market often moderates as larger market centers (e.g. Tokyo) and their corresponding equity bourses come online and any nascent data (e.g. China’s large trade deficit on Friday night) or geopolitical (i.e. Russia-Ukraine tensions) developments are taken into account. Other times, these early trends are pressed, suggesting global markets will begin the week with a broad risk-averse tone. As a general rule, then, the broad bid on the JPY such as this evening’s activity implies a lower open for equity futures when they begin trade shortly.
Twitter: @andrewunknown and @seeitmarket
Author carries no position in the instrument(s) mentioned at publication. Commentary provided is for educational purposes only and in no way constitutes trading or investment advice.
Charts courtesy of Oanda and TradingView.com
Any opinions expressed herein are solely those of the author, and do not in any way represent the views or opinions of any other person or entity.

: Worrisome to Broader Market?")

