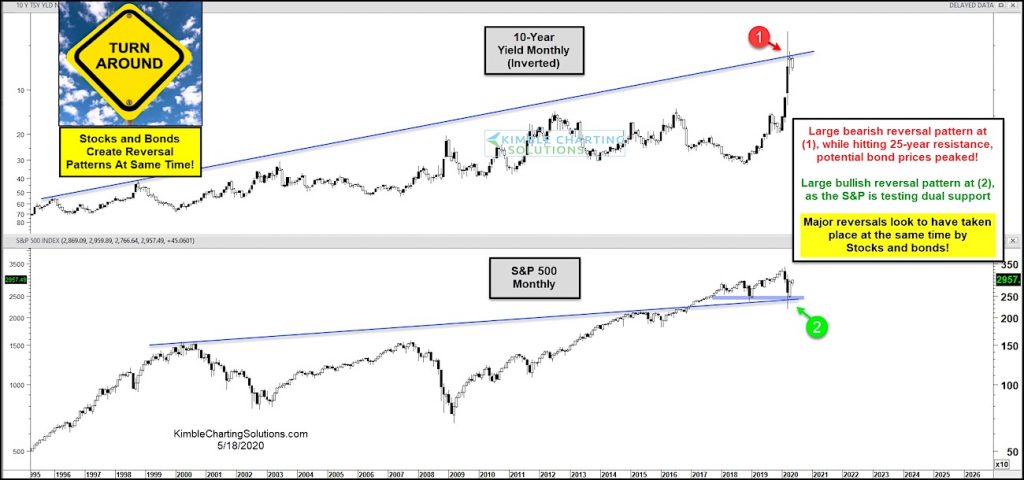
10-Year US Treasury Bond Yields (inverted) vs S&P 500 Index
The March crash was pretty much an everything crash.
But nearly as fast as the market crashed, it’s come back.
In today’s chart, we look at two very important asset classes: stocks and bonds. Stocks are represented by the S&P 500 Index and bonds are shown by an inverted chart of the 10 Year US Treasury Bond Yield.
As you can see, both stocks and bonds put in large reversal patterns at key trend support/resistance at the same time. [Inverted] Bond yields at (1) and the S&P 500 Index at (2).
Is this the mark of a turn around? Bulls hope these reversals hold – stay tuned!
Note that KimbleCharting is offering a 2 week Free trial to See It Market readers. Just send me an email to services@kimblechartingsolutions.com for details to get set up.
Twitter: @KimbleCharting
Any opinions expressed herein are solely those of the author, and do not in any way represent the views or opinions of any other person or entity.

 Testing Important Price Support")
: Cup (and Maybe Handle) Watch")

