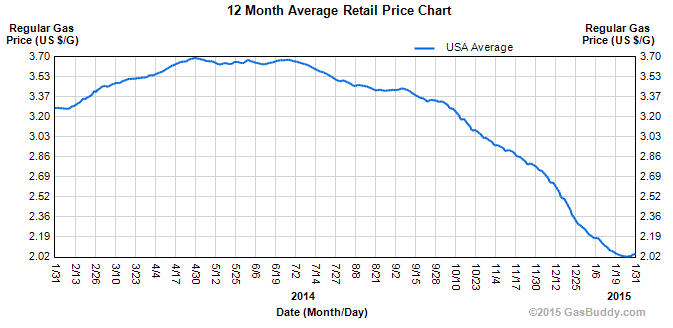
What an incredible decline we have seen in retail gas prices. It seemed Americans grew accustomed to paying north of $3 per gallon as oil prices ranged between $80 and $115 per barrel for several years. Perhaps a premium was put into some commodities in anticipation of massive amounts of QE resulting in some kind of inflationary spike.
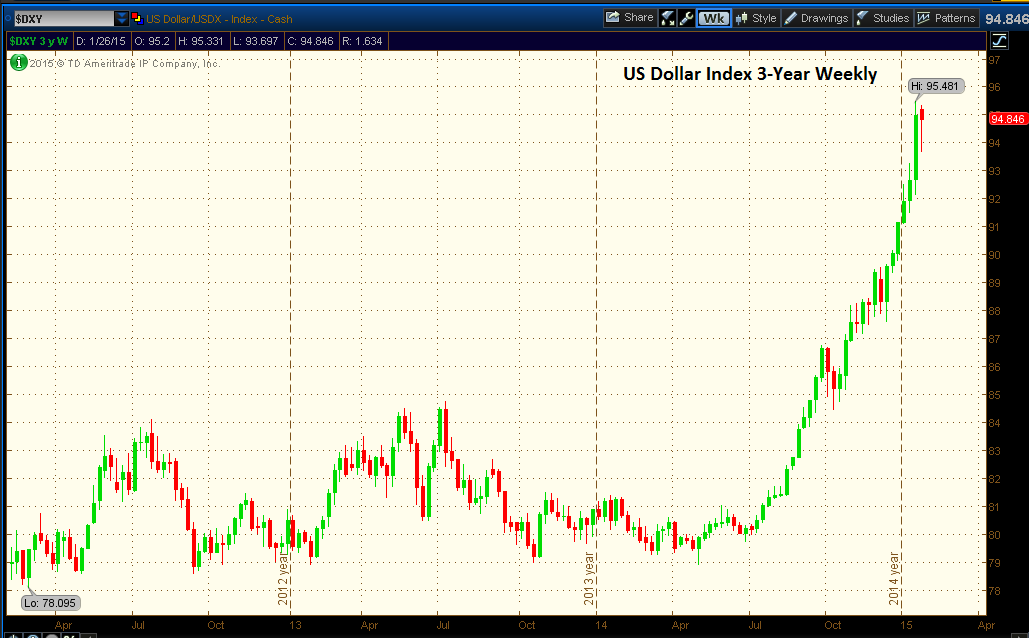
That never materialized, and the surge in the US Dollar Index since last spring may have been the nail in the coffin of that thesis as energy prices then plummeted.
US Dollar Index 3-Year Weekly Chart (click chart to enlarge)
Turning specifically to gasoline prices – in late February the RBOB Gasoline futures prompt month contract rolls out from the March to the April contract. This has implications for consumers as the April contract marks the shift from the cheaper winter blend to the summer blend of gasoline. The summer blend contracts are about 20-25 cents above the winter blend contracts, all else equal.
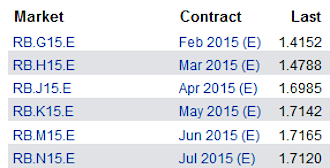
A rule of thumb is that retail gasoline prices sell for about 65 cents above the prompt month of RBOB. You will see in the above RBOB curve graphic that the April contract’s last print is near $1.70. The average USA retail price sums to near $2.35 once the April contract becomes the prompt month and the 65 cent premium is added. The current national average is $2.05. There is about a 3 week lag time for the futures price to get downstream to the consumer, so this implies about a 30 cent rise in retail gas prices by late March should futures prices hold steady.
Retail Gas Prices – GasBuddy
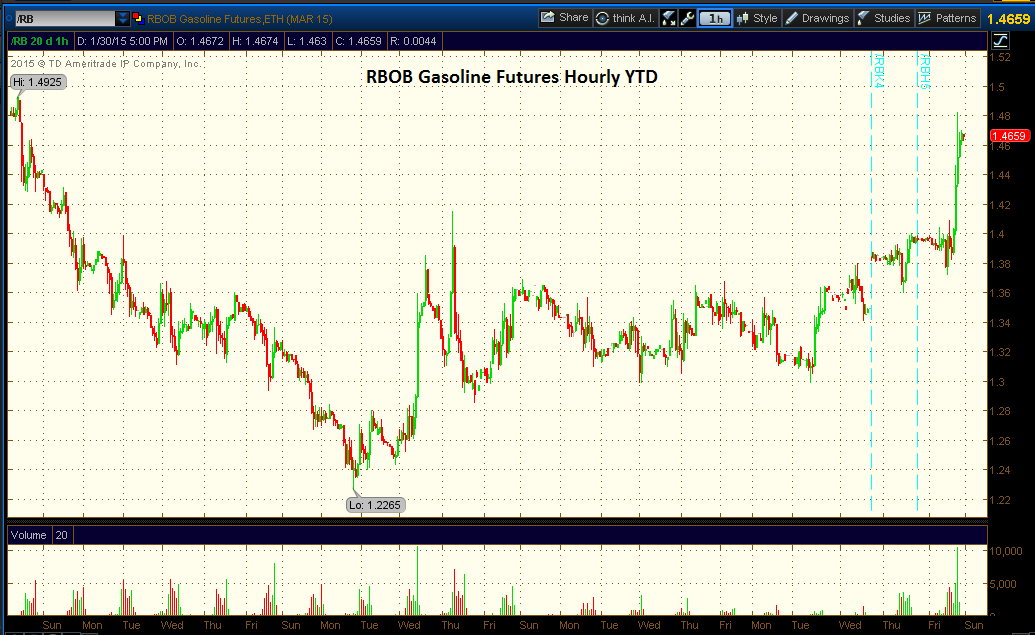
Gasoline futures bottomed a few weeks ago near $1.22, now trading about 20% above that low. The April contract’s print is nearly 40% above the January low. The futures market certainly suggests a bottom has been put in on retail gas prices.
RBOB Gasoline Futures – Hourly Chart
Thanks for reading.
Follow Mike on Twitter: @MikeZaccardi
No position in any of the mentioned securities at the time of publication. Any opinions expressed herein are solely those of the author, and do not in any way represent the views or opinions of any other person or entity.

: Worrisome to Broader Market?")
