For the past 5 years, the Emerging Markets have been caught in a sideways price channel. And the net result has been an outsized underperformance of the broader market.
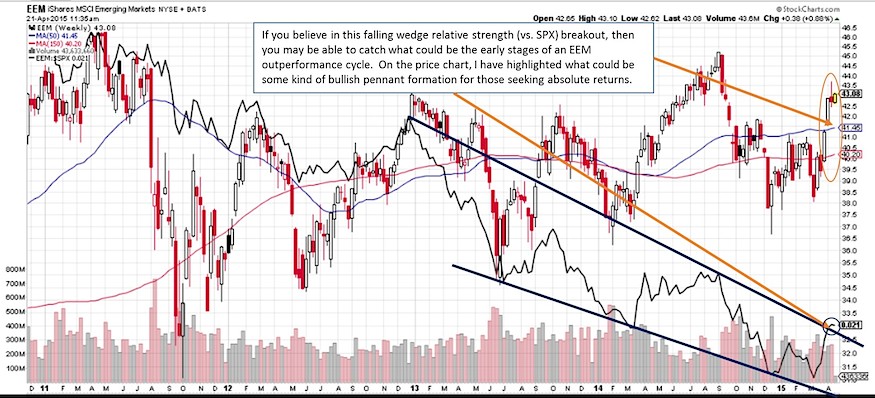
But 2015 is a new year and it appears that the iShares MSCI Emerging Markets ETF (EEM) is trying to reverse its fortunes. This will likely hinge on whether or not it can hold its recent relative strength breakout from a falling wedge pattern (vs the S&P 500). If you believe in this falling wedge relative strength breakout (vs. the S&P 500), then you may be able to catch what could be the early stages of an Emerging Markets outperformance cycle.
Note that I have also circled what could be some kind of bullish pennant formation on the weekly chart for those seeking absolute returns. If trading EEM, remember to monitor risk on both fronts. An RS move back below its breakout level would warn of of a continuation of recent underperformance. Also, a violation of the bottom of the price pattern could trigger some kind of stop/loss exit strategy.
Thanks for reading.
As a personal disclosure, I do not own or have a direct financial interest in any security mentioned. Although I am affiliated with T3 Trading Group LLC, opinions reflected are my own and should not be considered as investment advice.
Follow Jonathan on Twitter: @jbeckinvest
Any opinions expressed herein are solely those of the author, and do not in any way represent the views or opinions of any other person or entity.

 Testing Important Price Support")
: Cup (and Maybe Handle) Watch")

