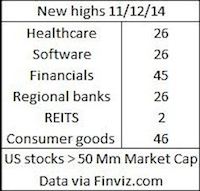
 Looking at the new highs list Wednesday, it was an incredible day for retail as 46 of roughly 200 names were consumer goods. What’s shocking is the group that came in second: 45 financials made the list with 26 being regional banks! That’s equal to the amount of technology and healthcare names!
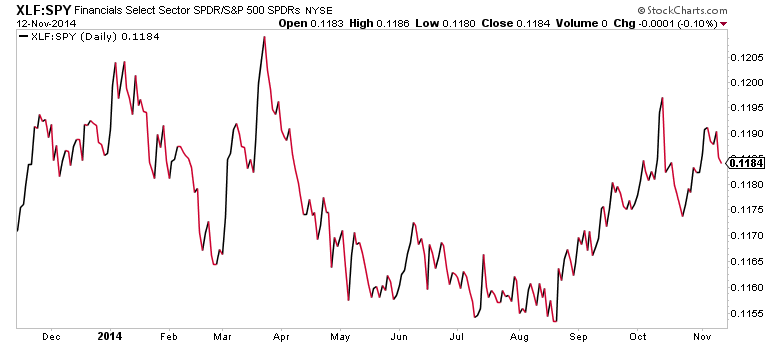
What’s interesting is that the financials as a whole aren’t showing much relative strength of late. Check out the chart below pitting the Financial Select Sector ETF (XLF) vs the SPDR S&P 500 ETF (SPY).
XLF:SPY Relative Strength CHART
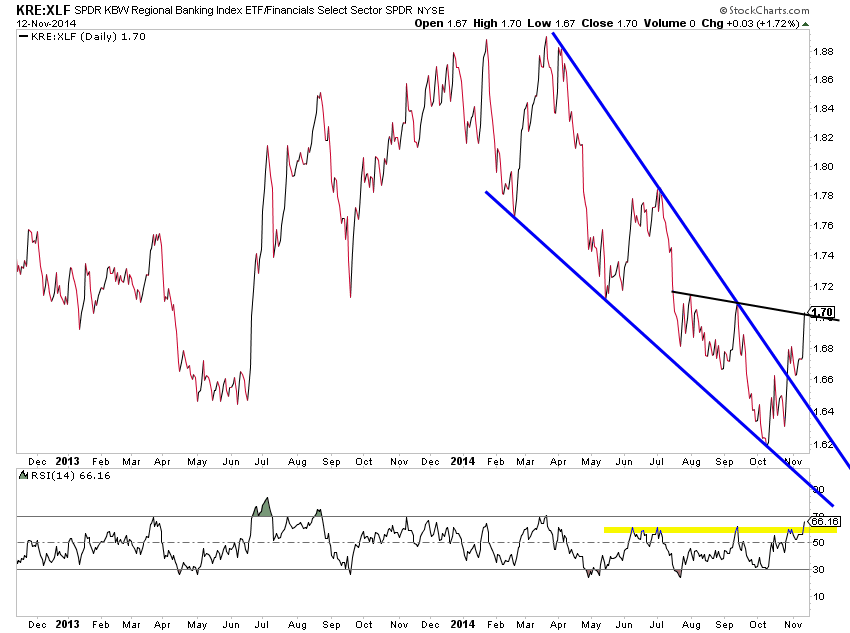
However, the relative strength shown of the Regional Banks ETF (KRE) within financials sector (XLF) has taken a positive turn. After breaking out of a year-long falling wedge, the Relative Strength Index (RSI) has made a new high as the ratio is currently challenging key resistance.
KRE:XLF Relative Strength Chart
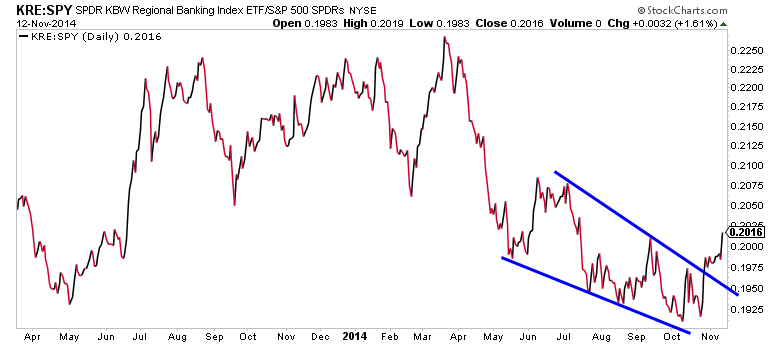
Now let’s look at another relative strength chart, comparing the regional banks (KRE) to S&P 500 ETF (SPY). As you can see below, the regional banks ETF has broken out of a falling wedge relative to SPY. The group has essentially separated itself from the rest of the financials.
KRE:SPY Relative Strength Chart
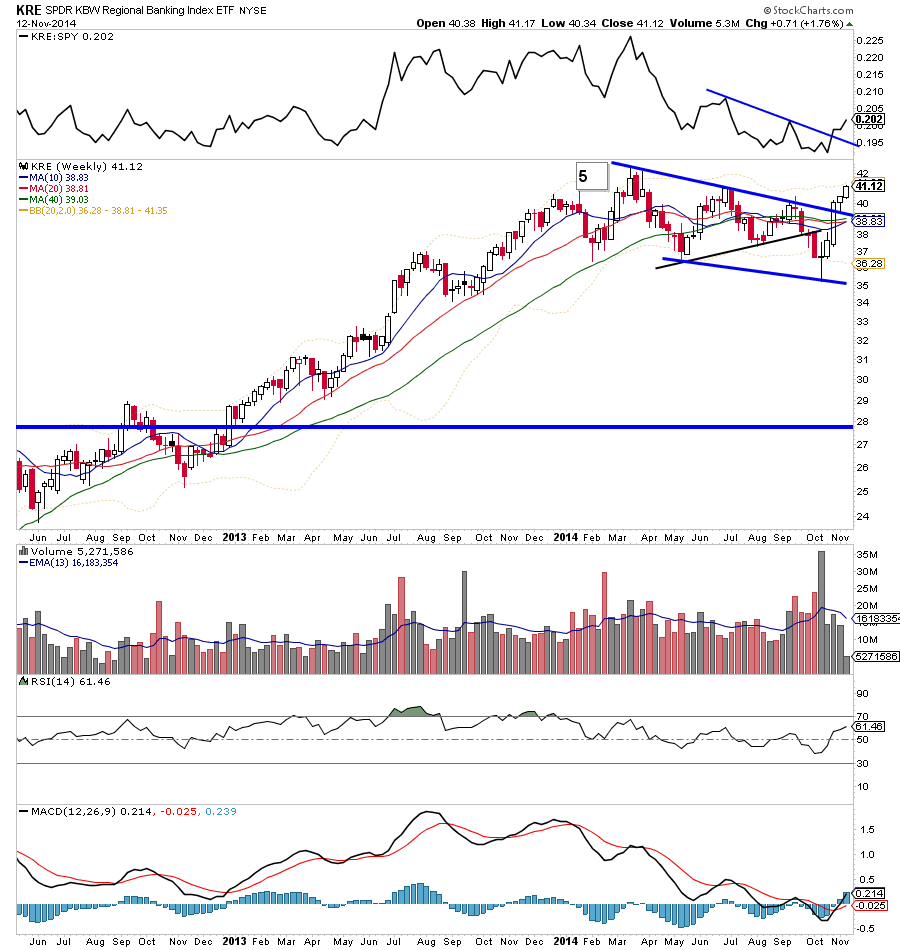
Now let’s simply look at the Regional Bank ETF (KRE) stock chart by itself. The main takeaway here is that KRE has broken out of a falling channel, trading just shy of its 2014 highs.
KRE Regional Banks ETF Chart
There are a number of possible reasons as to why Regional Banks may be trading better of late. Here are my speculative guesses: 1) They are under-owned and somewhat unfamiliar 2) A stronger consumer 3) Uptick in lending (or precursor to) 4) A sign that the whole financial sector is strengthening. Again, these are just possibilities and what traders really need to see is follow through to new 52 week highs… without follow through this is nothing more than a false start. I know I’ll be watching. Thanks for reading!
Follow Aaron on Twitter: @ATMcharts
No position in any of the mentioned securities at the time of publication. Any opinions expressed herein are solely those of the author, and do not in any way represent the views or opinions of any other person or entity.


