Supposedly … who knows what is true these days .. 1000’s of banks are underwater. OK … whatever.
Here’s when we look at the CHART and we ask should we BUY or SELL or DO NOTHING.
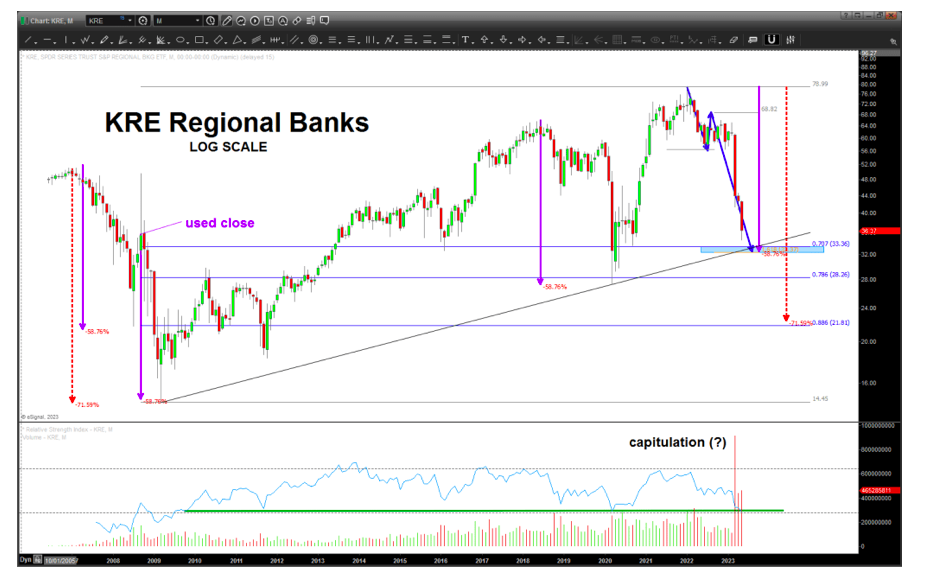
KRE sliced thru the first “potential support” and now we approach, what I think, is the KEY to the KRE.
Here’s why:
- 58.76 – if you look at the purple measured moves you will see that EVERY major swing down has been 58.76%. I’ve used the “close” in 2008 as I’m not sure if that is a good print or not .. either way, that measured move nails EVERY LOW
- 1.618 projection lands … right at the 58.76 correction.
- .707 (square root of 2 = 1.4142 and 1/1.4142 = .707) just a little above this level
- Long term LOG trend line right at .. all the above
- Note the VOLUME – is that a capitulation spike in selling volume?
- RSI sitting at the crucial support level for the ENTIRE bullish move since 2009
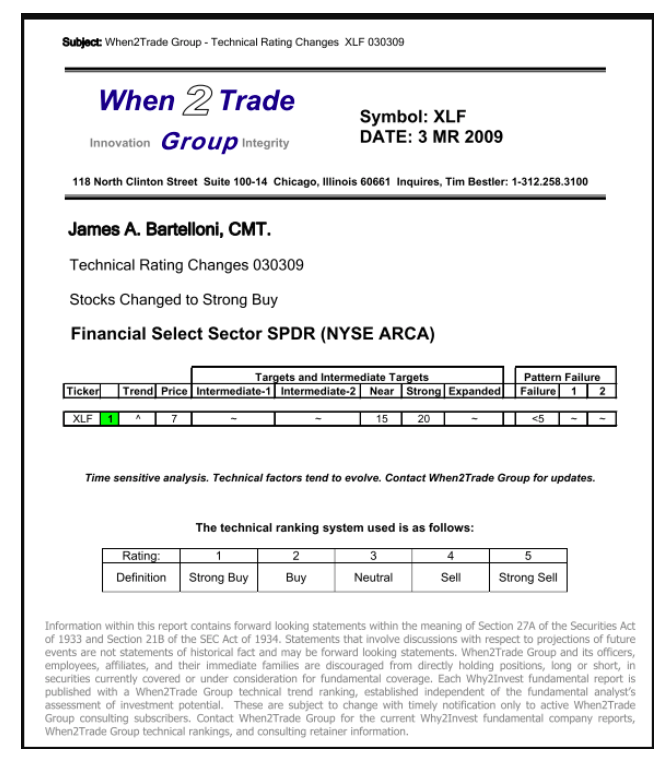
Nobody in their right mind is looking to BUY the banks but, then again, I can guarantee you NOBODY was looking to buy in March 2009. Maybe there was someone? Perhaps … me?
DATE STAMPED 3 MR 2009. (March 3, 2009)
Here’s why:
So, watch the THRUST coming into this level. Maybe wait for a signal reversal candle (bullish).
What I can say is IF we blast thru this level (certainly “feels” like we should) then, yeah, a lot of banks are looking at some tough times and 28 and then 21 are the next targets.
Twitter: @BartsCharts
Author does not have a position in mentioned securities at the time of publication. Any opinions expressed herein are solely those of the author, and do not in any way represent the views or opinions of any other person or entity.

: Worrisome to Broader Market?")
