As trade tension increase, investors are adopting a more defensive posture.
The Real Estate sector (NYSEARCA:IYR) is beginning a bottoming process relative to the S&P 500 presenting investors with an opportunity to find names which are making the turn from bearish to bullish.
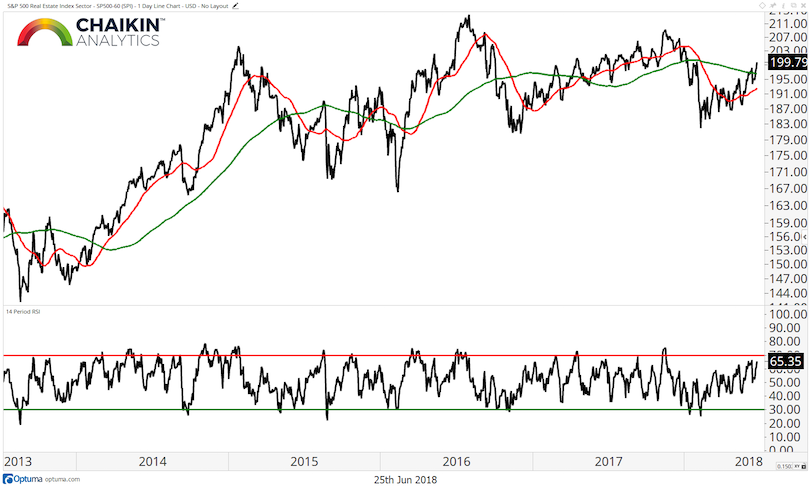
S&P 500 Real Estate Index (Absolute)
The S&P 500 Real Estate Index has been moving sideways (on an absolute basis) since January 2015 as we can see in this five-year chart.
The index has moved back over the 200-day moving average and the 50-day moving average is beginning to move higher. The RSI has marked a series of higher lows since the oversold reading in February.
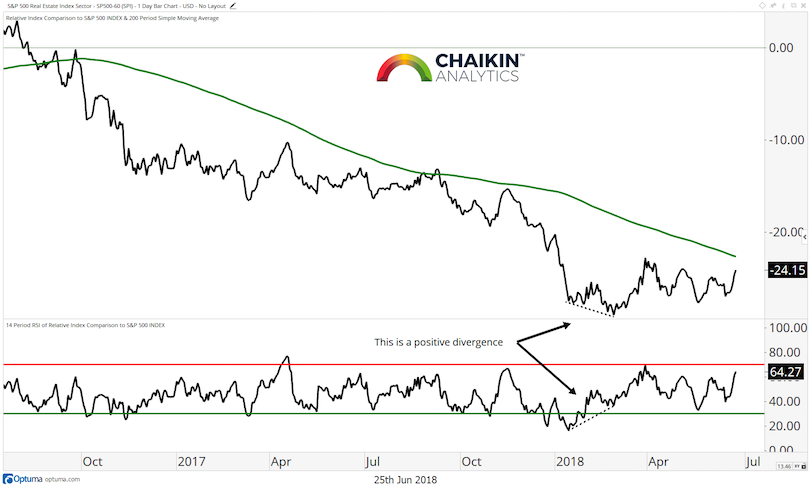
Real Estate Relative to the S&P 500
On a relative basis, the Real Estate index has been moving sideways since the beginning of 2018. The ratio remains below the falling 200-day moving average so we are not ready to sound the “all clear” yet. However, the February 27th low in the ratio was not confirmed by momentum as the RSI made a higher low and has not become oversold since. We are open to the idea that a bottoming process is underway on a relative basis.
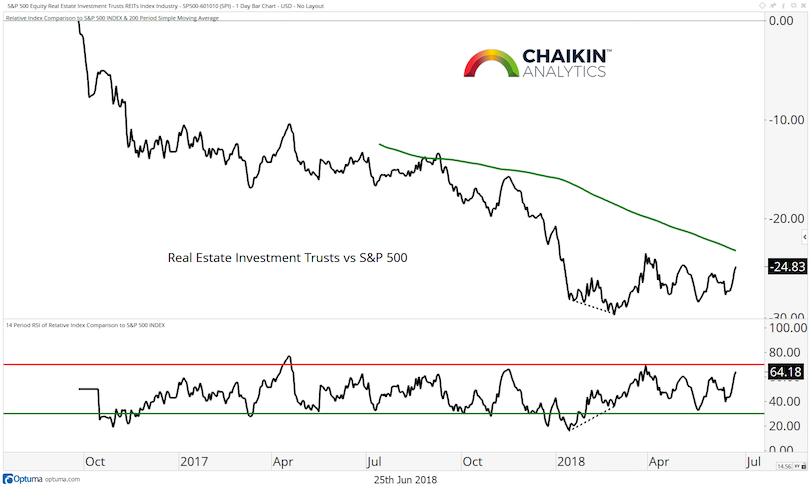
Real Estate Investment Trusts Relative to the S&P 500
The Real Estate Investment Trust index relative to the S&P 500 has been moving sideways since the beginning of 2018. The ratio remains below the falling 200-day moving average so we are not ready to sound the “all clear” yet. However, similar to the Real Estate sector, the February 27th low in the ratio was not confirmed by momentum as the RSI made a higher low and has not become oversold since.
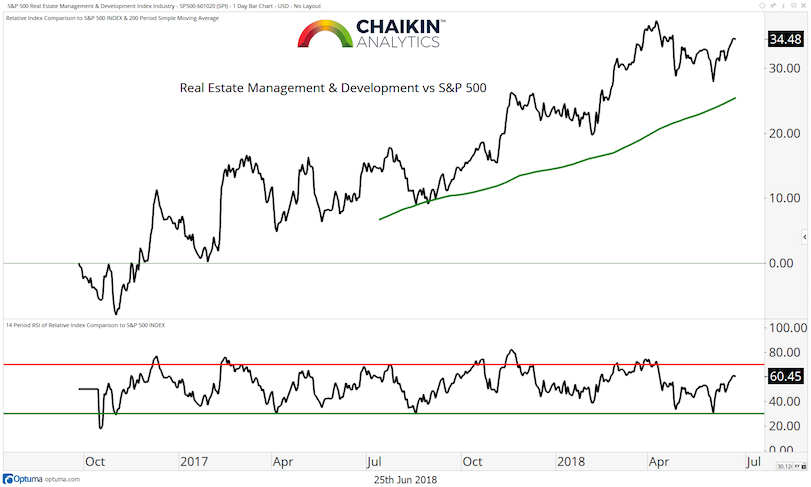
Real Estate Management & Development Relative to the S&P 500
The Real Estate Management & Development index has been in a steady uptrend relative to the S&P 500 since its inception in late 2016. The ratio is above a rising 200-day moving average but the RSI may be in the process of shifting to bearish ranges which could be an early warning for the group.
The Take-Away: While the Real Estate sector is not out of the woods yet, we are open to the idea that a bottoming process is underway on a relative basis.
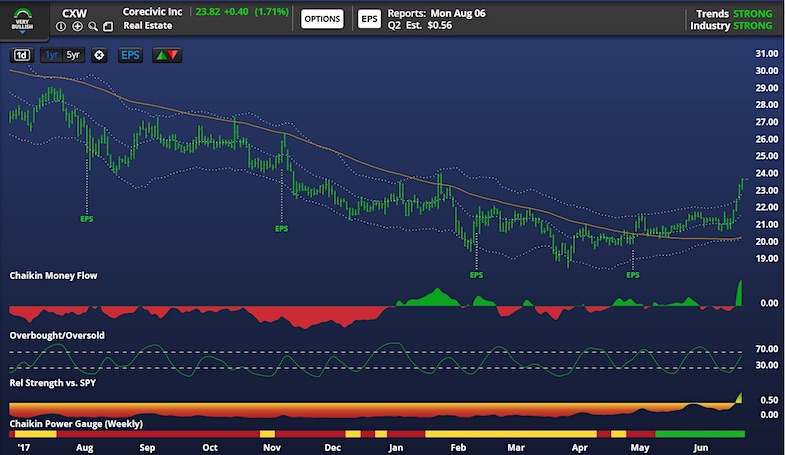
Stock Idea: Corecivic Inc (CXW)
CXW has a Very Bullish Chaikin Power Gauge rating after spending most of the past 12 month with a bearish or neutral rating. The stock is just beginning to outperform the SPY after lagging for quite a while. CXW is not yet overbought based on our OB/OS indicator and Chaikin Money Flow just spiked to a bullish reading (could be due to the Russell reconstitution on Friday). Above $21.80, CXW has upside to $31.
Twitter: @DanRusso_CMT
Author may have a position in mentioned securities at the time of publication. Any opinions expressed herein are solely those of the author, and do not in any way represent the views or opinions of any other person or entity.

: Showing Some Signs of Emerging Strength")
