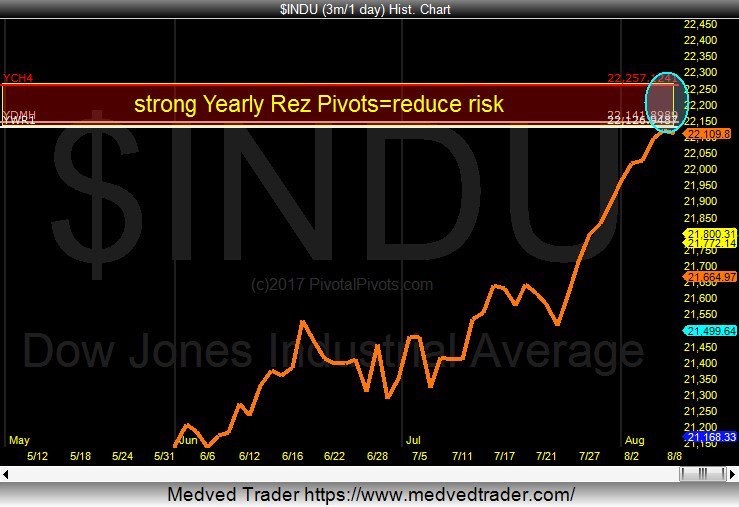
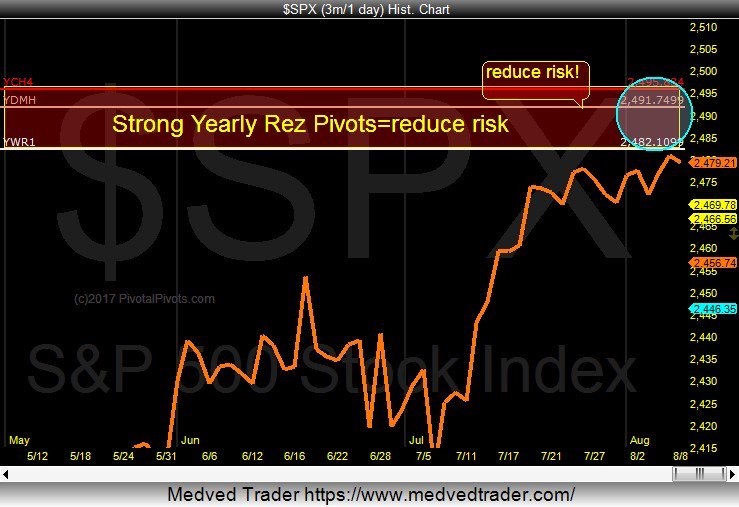
This week the S&P 500 Index (INDEXSP:.INX) and the Dow Jones industrial Average (INDEXDJX:.DJI) both went up and tested a confluence of strong yearly resistance pivots.
Is the stock market topping? Are investors in for another correction?
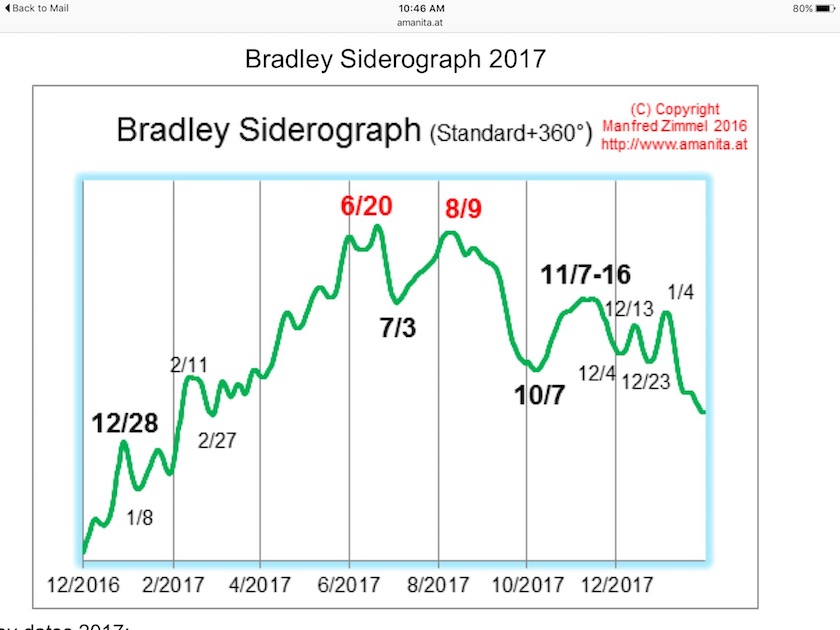
Well, it’s probably a good idea to be cautious here. This week marks a Bradley model long term trend change date (see chart below). I wrote about this last June. This may be the start of a big stock market pullback! I’m thinking 10%-20%.
August, September, and October tend to be a volatile time of year for the financial markets. I have been recommending to my subscribers at PivotalPivots to reduce or hedge risk coming into the yearly resistance pivots (see Dow Industrials and S&P 500 charts further below).
Bradley Siderograph (via Martin Zimmel)
Dow Jones Industrial Average – Pivot Resistance!
S&P 500 Pivot Resistance!
It has been 2 years since the last deep correction. Is the next one right around the corner? I feel this is a good time to take some long-term profits off the table or hedge!
Thanks for reading and trade safe!
Twitter: @Pivotal_Pivots
The author may have a position in mentioned securities at the time of publication. Any opinions expressed herein are solely those of the author, and do not in any way represent the views or opinions of any other person or entity.


