It’s been a crazy last couple of years. And that is probably an understatement.
And 2022 is off to a similar start with supply disruptions, surging inflation, and war overseas.
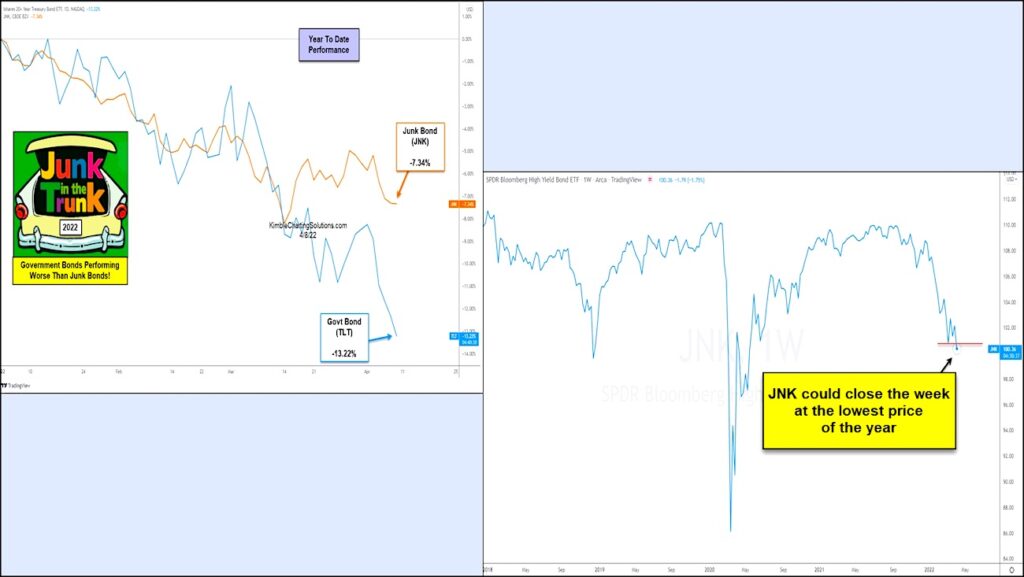
Needless to say, stocks are trading lower this year. And, no surprise, junk bonds are trading lower as well. But what is surprising is that the often safe-haven US treasury bonds (TLT) are trading down… by a lot.
Today’s chart 2-pack looks at how the junk bonds ETF (JNK) is out-performing the government bonds ETF (TLT). Not very often that you see stocks get hit and treasuries perform worse than junk bonds.
Also, you can see that junk bonds are at an important intersection after closing last week at the lowest price of the year. Bulls better hope for a quick recovery or we could see some mean reversion as junk bonds head lower. Stay tuned!
Junk Bonds Performance versus US Treasury Bonds & solo Chart
Note that KimbleCharting is offering a 2 week Free trial to See It Market readers. Just send me an email to services@kimblechartingsolutions.com for details to get set up.
Twitter: @KimbleCharting
Any opinions expressed herein are solely those of the author, and do not in any way represent the views or opinions of any other person or entity.
: Cup (and Maybe Handle) Watch")
 Trading Near Top Of Price Range")
 Reaches Important Price Support")