It is no secret that small cap stocks have been out of favor.
And underperforming!
BUT lately small cap stocks have been in rally mode. So is there any reason for the recent buying? And could this continue?
Today we look at a “weekly” chart of the Russell 2000 ETF (IWM) to try to answer these questions.
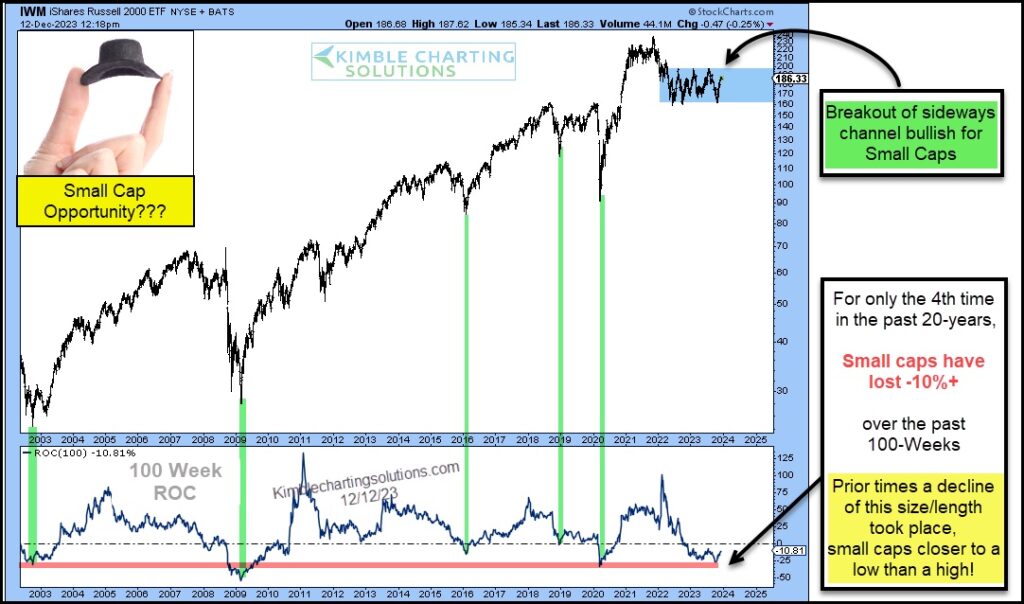
Rarely has the Russell 2000 been down 10%+ in a 100-week window… but as you can see in the lower pane of today’s chart, this recently occurred (see black arrow). Note that each of the prior times this occurred is connected with a green line.
Clearly, when the Russell 2000 (IWM) has been down this much it indicates that small caps are closer to important lows than highs. Why? Because each time the small cap index embarked on a big rally.
Is this happening again now?
One way to “tell” for sure is by watching the blue shaded area marking the past 2-years of sideways price action. In my humble opinion, it sure would be bullish if IWM breaks out above the top of this channel. Stay tuned!
$IWM Russell 2000 ETF “weekly” Chart
Note that KimbleCharting is offering a 2 week Free trial to See It Market readers. Just send me an email to services@kimblechartingsolutions.com for details to get set up.
Twitter: @KimbleCharting
Any opinions expressed herein are solely those of the author, and do not in any way represent the views or opinions of any other person or entity.


