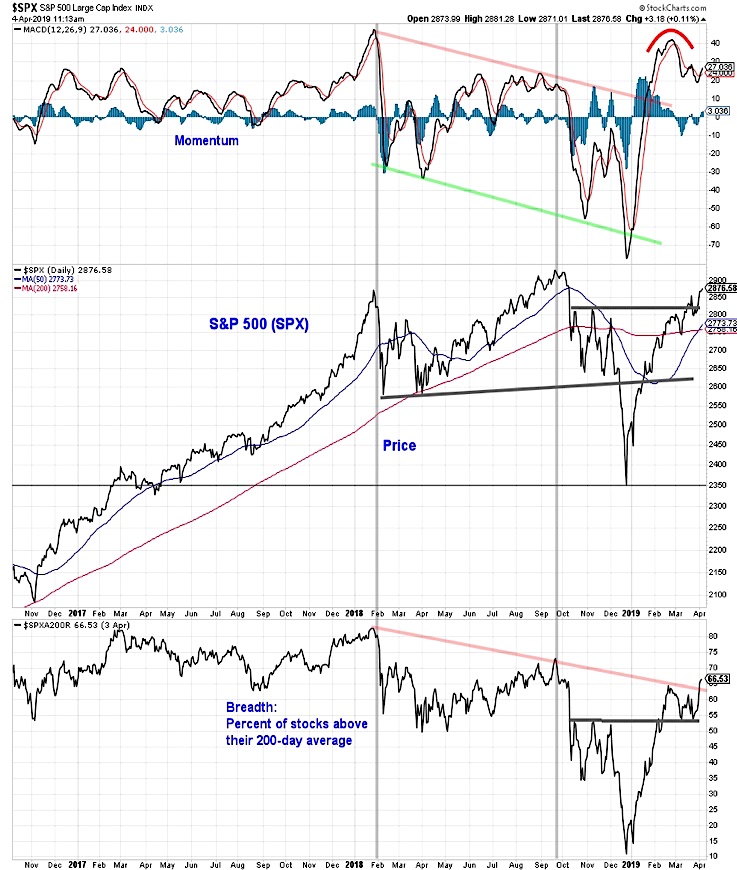
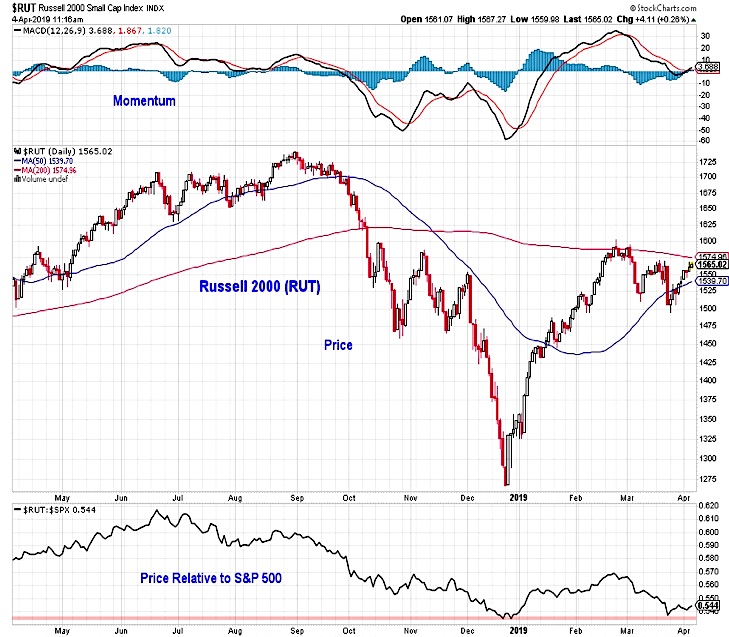
Key Takeaways: With momentum lacking, the price rally has gotten more ragged. The S&P 500 (SPX) is approaching its September peak, but small-caps are still shy of where they were in February.
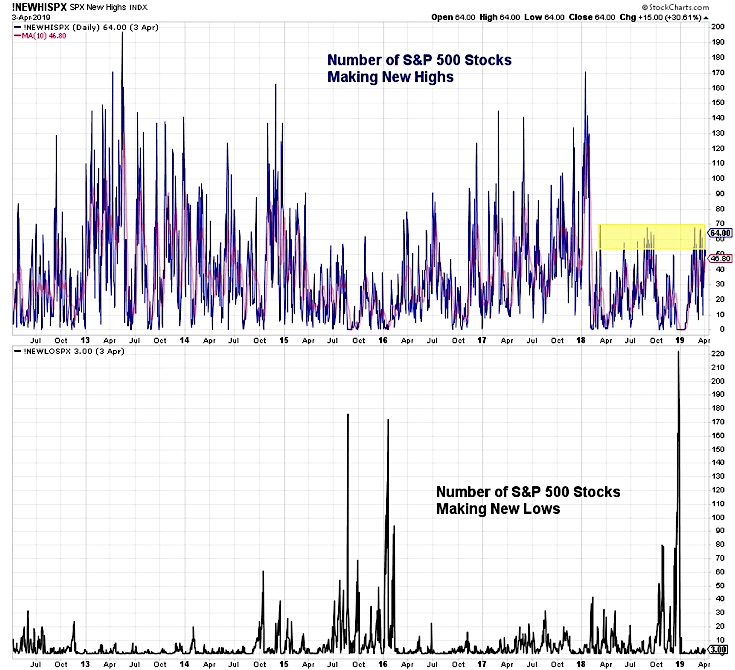
Breadth has seen some improvement, but the new high list remains relatively narrow. With optimism rising, risks would increase if equity fund flows turn positive.
The S&P 500 has moved within an afternoon’s worth of giddiness of its September peak. While investors can anchor to a final new high as evidence of a market peak, the emergence of new highs actually tend to be important confirmation in cyclical bull markets and are a sign of strength.
On the other hand, bear market rallies that stop shy of new highs provide evidence that the bear market may still be intact. Momentum on the S&P 500 has cooled since earlier this year but after some stabilization it may be set to expand. Breadth, as measured by the percentage of stock trading above their 200-day averages, went through a consolidation and has moved to a new rally high. The next upside target may the 72% reading that accompanied the September index peak.
The global breadth backdrop remains challenging, with less than one-third of the markets in the all-country world index in uptrends. If the S&P 500 is not yet ready to challenge its highs, 2800 looks like an initial support level.
The price rally in the S&P 500 not only lacks global support, but has not been echoed by domestic small-caps either. After an initial surge in relative to the S&P 500 in early 2019, the Russell 2000 (RUT) has struggled to keep pace in recent weeks. Small-caps have returned to their relative price lows of late 2018. Relative price weakness is not just a function of large-cap strength. The Russell 2000 currently trades where it was in mid-March and is below both its 200-day average and its mid-February highs. Its August 2018 peak is more than 10% above its current level.
The case for new highs on the S&P 500 would be improved if the new highs list were able to meaningfully expand. Over the past year, the number of S&P 500 stocks making new highs on any given day has peaked between 50 and 70. This is low by historical standards if a cyclical bull market has emerged (or is emerging).
During the 2016-2017 bull market, the new high list made a series of higher highs. This was also the case during the cyclical bull market that emerged in the wake of the 2011 lows. Right now, the list pool of potential new highs is somewhat small – only two-thirds of stocks are even above their 200-day averages, and one quarter of S&P 500 stocks remain more than 20% away from their highs. We would also suggest keeping an eye on the new low list, as an expansion there could suggest conditions are deteriorating.
The latest move higher by the S&P 500 appears to have contributed to (and may be fueled by) some degree of capitulation by stock market bears. The overall level of bulls and bears was little changed on this week’s Investors Intelligence survey, but the bull-bear spread did reach its highest level since October. The NAAIM Exposure index, however, surged from 62% to 92%, moving to its highest level since August. Details within that survey show even the most bearish investment manager has net long exposure to equities. In other words, the NAAIM data suggest pretty much everyone is back in the pool.
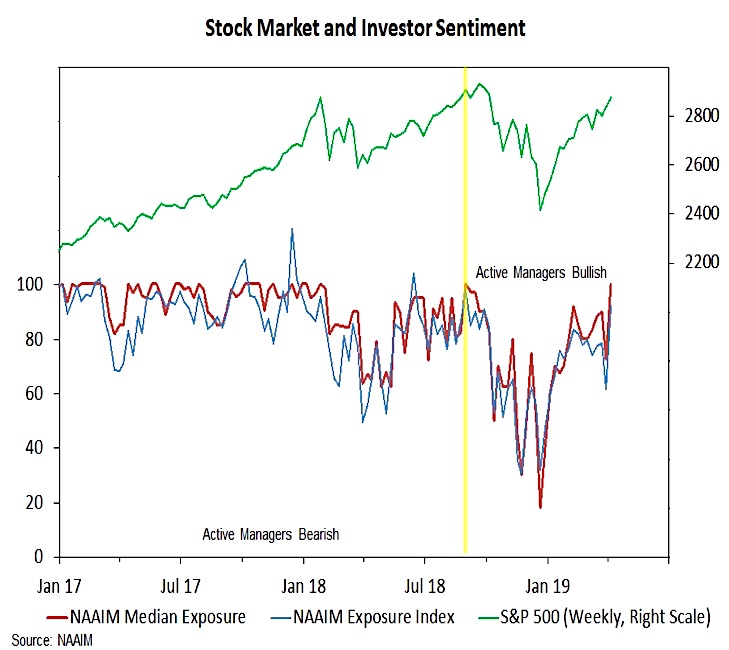
While sentiment surveys and options data (as mesaured by the various put/call ratios) show rising optimism, fund flows have reflected more caution. From a contrarian perspective, this has helped buoy stocks so far in 2019. While the pace of outflows has slowed from the late-2018 surge (nearly $100 billion over the course of the final four weeks of the year), funds flowed away from equities over the course of the first quarter.
We are watching this for confirmation that bears may be capitulating. Some evidence of that has emerged. Looking at just ETF flows, equities garnered only $17 billion of inflows (the net outflows being accounted for by mutual funds) over the course of the first quarter, but this week so far have seen $5 billion in inflows. If this persists, stock market risks would likely rise.
Twitter: @WillieDelwiche
Any opinions expressed herein are solely those of the author, and do not in any way represent the views or opinions of any other person or entity.


 Rolling Over At Key Fibonacci Level?")