 By Andrew Nyquist
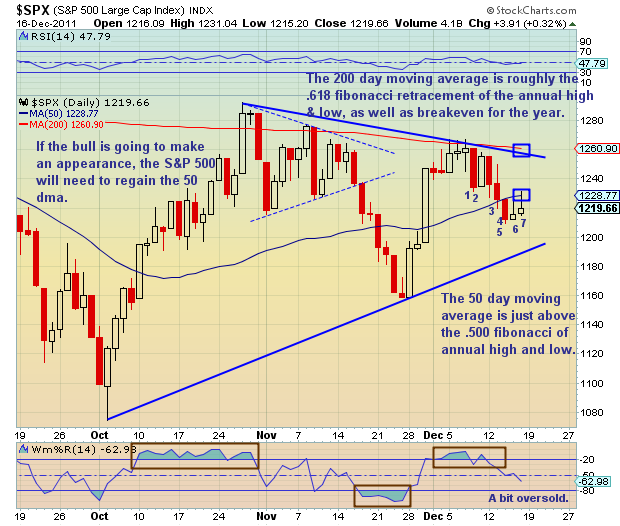
This week, the markets continued their slide down the slippery slope. But that slide may finally find a bottom early next week. Currently the S&P 500 is nestled below its 50 day moving average, but above its lower level trendline support, which could prove to be pivotal. DeMark analysis indicates that the S&P 500 is on bar 7 of a daily TD DeMark Buy set up, suggesting a possible bottom Monday or Tuesday [at least short term]. Just in time for a holiday rally??? We shall see.
I am sitting at roughly 35% long exposure and looking to add to positions next week… with stops to limit downside risk. See annotated chart below, and keep risk management in mind, as the market has a lot to prove.
Have a good rest of your weekend.
———————————————————
Your comments and emails are welcome. Readers can contact me directly at andrew@seeitmarket.com or follow me on Twitter on @andrewnyquist. For current news and updates, be sure to “Like” See It Market on Facebook. Thank you.
Position in S&P 500 related index fund (SPY) at time of publication.
Any opinions expressed herein are solely those of the author, and do not in any way represent the views or opinions of his employer or any other person or entity.


