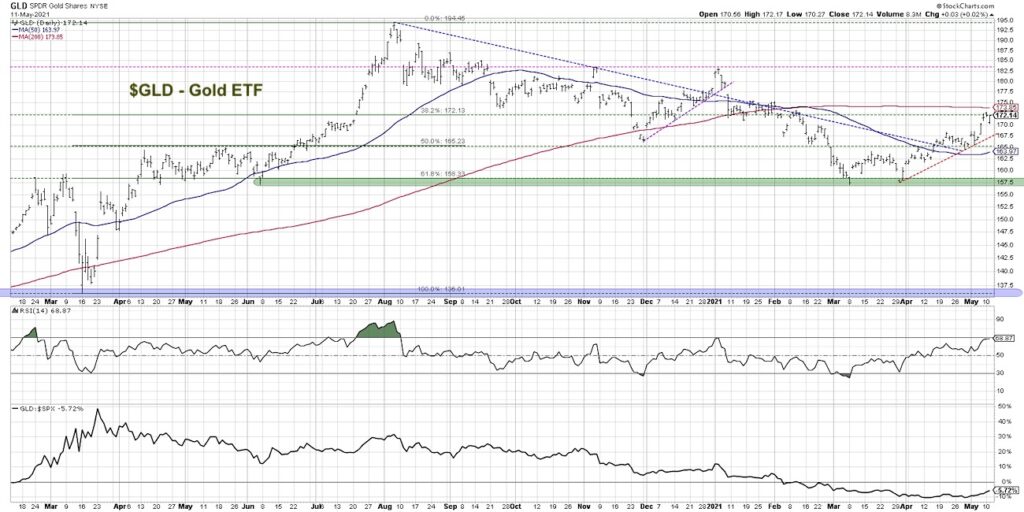
After reaching a peak in May 2020, gold has been in a fairly consistent downtrend. In early March, we shared how a confluence of support based on price levels and Fibonacci retracements suggested a bottom for gold prices.
In today’s video, we’ll update the chart of gold and reflect on how the GLD is now overbought as it reaches a confluence of resistance. While the short-term trend appears to be nearing exhaustion, the long-term trends remain robust as inflation fears grow with investors.
– How would a short-term pullback in gold relate to the long-term uptrend started in March?
– What does the recent overbought condition tell us about short-term and long-term trend characteristics?
– What price movements would confirm a resumption of the long-term uptrend?
For deeper dives into market awareness, investor psychology and routines, check out my YouTube channel!
One Chart: Gold Update [VIDEO]
Gold Chart
Twitter: @DKellerCMT
The author may have positions in mentioned securities at the time of publication. Any opinions expressed herein are solely those of the author, and do not in any way represent the views or opinions of any other person or entity.


: Showing Some Signs of Emerging Strength")
