Priceline (NASDAQ:PCLN) beat earnings but watched its stock price plummet as they didn’t meet investors expectations.
As a Fibonacci trader aka “The Fib Doctor”, I adhere to a strict philosophy around Fibonacci principles, including retracements and extensions to find support, resistance, and price targets.
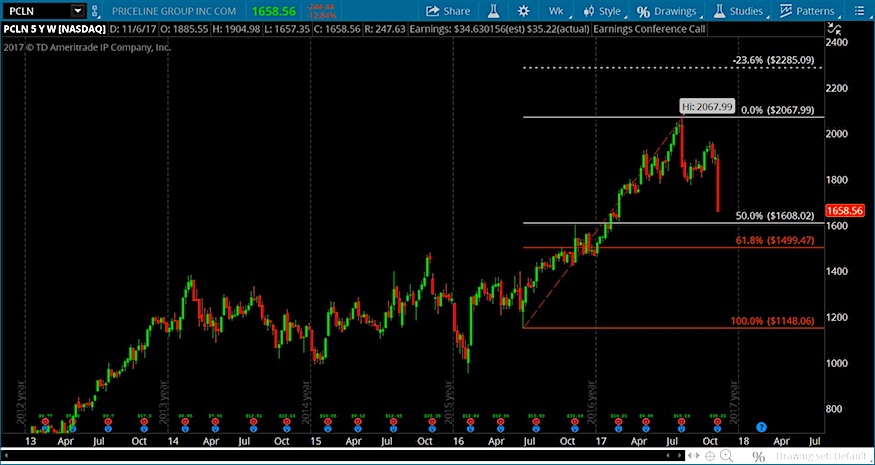
Right now, I’m looking at Priceline’s stock chart (see below). After reaching a top well above 2000 dollars per share (2067.99 to be exact), Priceline’s stock (PCLN) began a correction / retracement. That correction was accelerated following its earnings report this week.
Using the low and high of the latest wave, we can project some fibonacci price support levels. These are potential “buy” levels for active investors with a plan. As I always mention, there’s no such this as a plan without a stop and a target for taking profits.
First support: $1608.02
Second support: $1499.47
If the stock remains in bullish posture, one of these two levels should hold. If not, step out of the way (i.e. why we use stops!). Any move back to new highs would initially target 2285.09.
Priceline Stock Chart – PCLN – with Fibonacci Support Levels
Thanks for reading!
Twitter: @TheFibDoctor
No position in any of the mentioned securities at the time of publication. Any opinions expressed herein are solely those of the author, and do not in any way represent the views or opinions of any other person or entity.


