Precious metals continue to be a major headline and investing theme this year.
A declining US Dollar and uncertain economic future (due to coronavirus fears) has energized Gold and Silver investors. Both Gold and Silver have made multi-year highs, with Gold hitting new all-time highs over the $2000 mark in August.
Today we look at charts of both. And, as usual, we keep the charts clean and let the price patterns and trends speak for themselves.
It’s important to point out that the precious metals market is healthy and strong when Silver leads (just like when small caps lead – it sends a stronger message about risk taking). And we have seen Silver take the lead in recent months. Bull want this to continue.
Note that the following MarketSmith charts are built with Investors Business Daily’s product suite.
I am an Investors Business Daily (IBD) partner and promote the use of their products. The entire platform offers a good mix of technical and fundamental data and education.
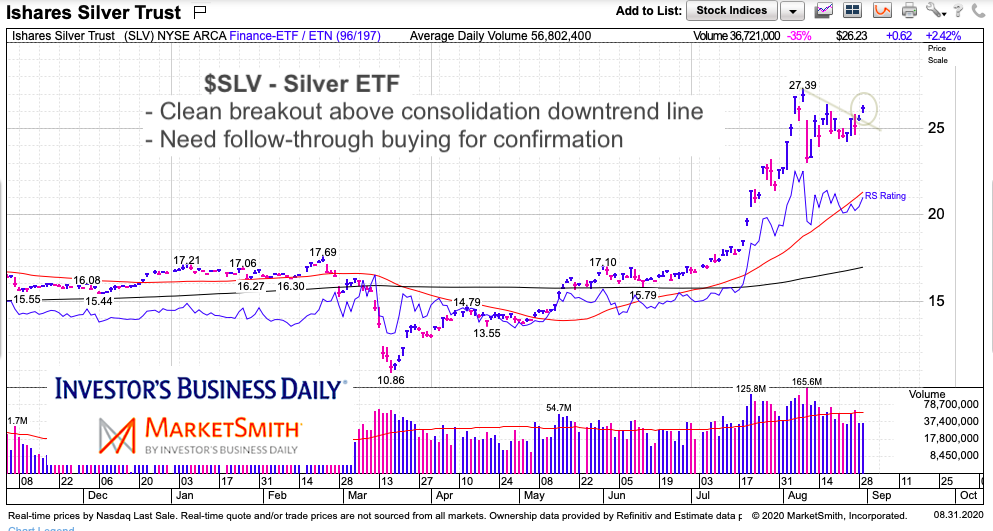
$SLV Silver Chart
Silver is first on purpose. SLV gapped higher on Friday in a clean breakout attempt. A breakout that makes new highs could target 30.43 (the 1.618 Fibonacci extension level).
However this plays out, any breakout for SLV bodes well for Gold… but we need to see follow-through buying.
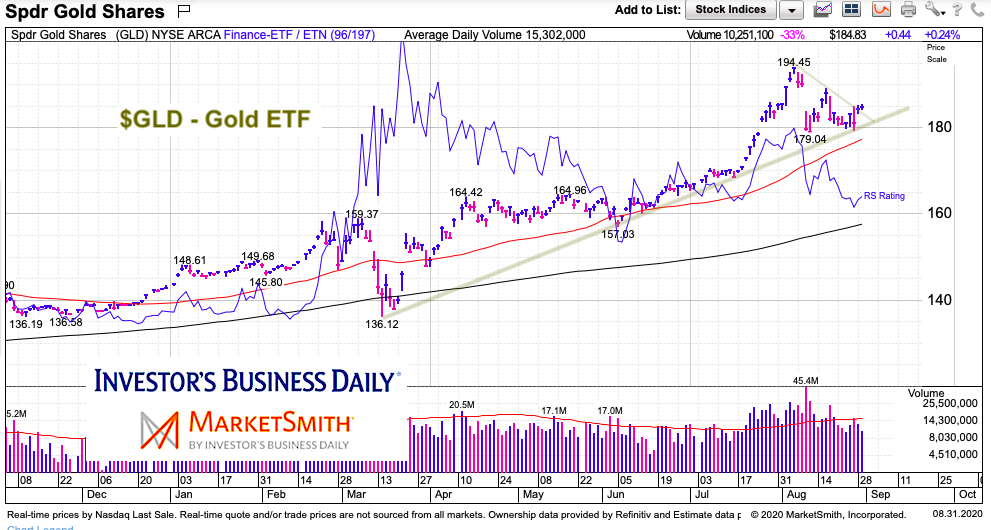
$GLD Gold Chart
Gold’s breakout attempt is a bit weaker. A burst of buying would be good to see in the days ahead.
A break to new highs could target 203.97 (the 1.618 Fibonacci extension). But let’s wait for follow-through first. Stay tuned.
Twitter: @andrewnyquist
The author may have a position in mentioned securities at the time of publication. Any opinions expressed herein are solely those of the author, and do not in any way represent the views or opinions of any other person or entity.

 Rolling Over At Key Fibonacci Level?")


 Rolling Over At Key Fibonacci Level?")