Today is ‘interesting chart’ day and with bonds in the spotlight nearly every day of late, this chart is worth a look.
The chart of the 20+ Year Treasury Bonds ETF NASDAQ: TLT has gone parabolic, but as I imply in today’s title, the TLT’s have been here before.
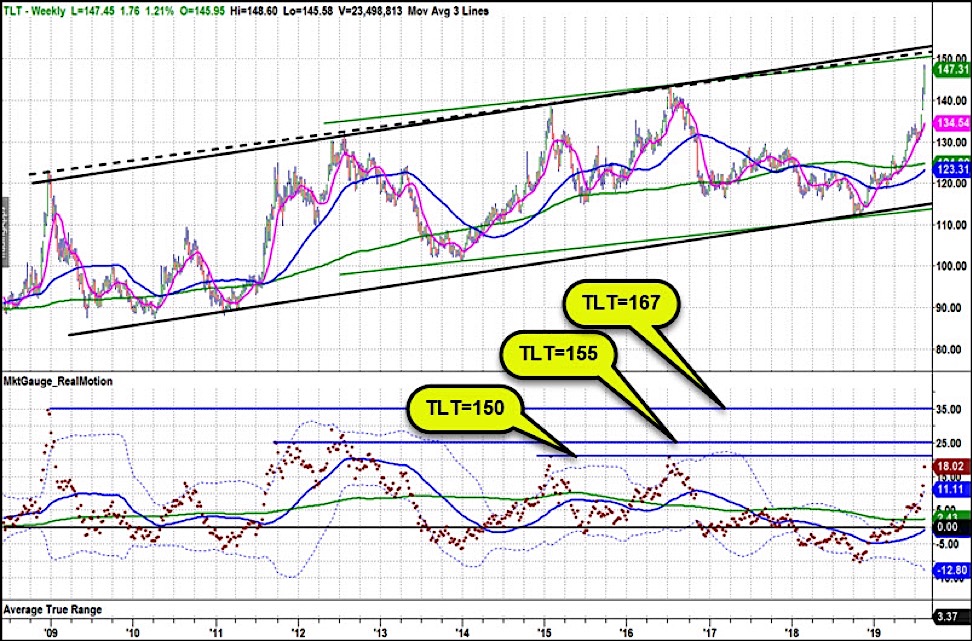
By that I mean, if you look at the Real Motion chart below the candlestick chart, the dots represent the daily momentum level.
Real Motion users know that the peaks of these levels often identify resistance that you otherwise can’t see on the chart.
For example, the TLT Treasury Bonds price peaks of 2011 and 2012 occurred at different price levels, but at about the same level of the Real Motion dots, or momentum.
The same pattern occurred at the 2015 and 2016 peaks.
TLT is now very close to those levels in terms of Real Motion. I’ve labeled the Real Motion levels with approximate corresponding price levels so you can see that the 2016 momentum level would come in at about 150 in TLT.
This becomes even more interesting when you consider the green and black lined channels. The channels are based on parallel lines drawn from their respective trend lines on the swing lows.
The dashed line is a resistance line based on connecting highs.
From the looks of this picture, the 150-155 level looks like a reasonable place to expect this parabolic move to stall out.
However, if it breaks out these channels, the TLT’s have been as high as 167 in Real Motion terms. See the 2008 peak.
Years ago, I would have pushed back on this being possible with the argument that interest rates can only go to zero.
But now we all know, that’s not true.
One final note, this says nothing about TLT needing to decline, or timing a decline. It’s only suggests that there’s real resistance nearby.
ETF Levels:
S&P 500 (SPY) Support at swing low, 281.72. Big support area is 280 to 277.70 (the 200 DMA). Resistance at 287.
Russell 2000 (IWM) Broke June low but didn’t follow through. Support at Today’s low 144.79.Resistance around 147.50.
Dow (DIA) Broke swing low and recovered.Swing low support levels are 253.93 and June low of 247.Resistance at 258.50 and then around 264.50.
Nasdaq (QQQ) Swing low is at a trendline from the December 2018 low. Resistance at 183.50 then 190.70.
KRE (Regional Banks) Closed weak. Support at today’s low, 48.52 then Dec. low, 44. Resistance around 50, then 51.50.
SMH (Semiconductors) Support at area around 108.40, then swing low of 107.41. Resistance at Wednesday’s high 11.50 then 114.19, then 116.
IYT (Transportation) Broke June low and recovered. Today’s low support at 174.53. Resistance at 179 then 186 then 191.
IBB (Biotechnology) August low support at 101.43. Looks interesting if it can close over 107.
XRT (Retail) Lowest close since June 2013. Closed below swing lows in Dec. 2018, 2015, 2017. Support at 35? Major resistance around 41.50.
Twitter: @marketminute
The author may have a position in the mentioned securities at the time of publication. Any opinions expressed herein are solely those of the author, and do not in any way represent the views or opinions of any other person or entity.


