 Today I want to talk about the one by two ratio vertical spread, both long and short. Both are excellent options trading strategies although the one with the most risk works more often than the one with unlimited profit potential.
Let’s examine the long ratio vertical where you own one option and are short two further out of the money (OTM) options. And you want to do this for a net credit.
Using Calls, the P&L graph looks like the image to the immediate right:
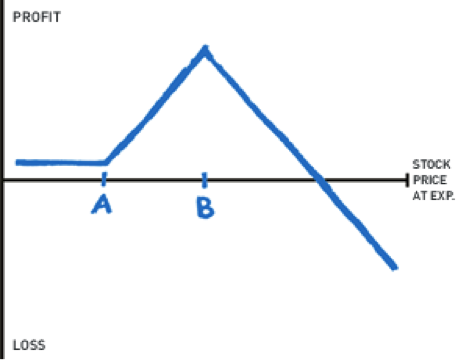
Long one call, strike A and short 2 calls, strike B. If both strikes expire worthless the profit is the credit received. Maximum profit occurs with expiration exactly at the short strike, strike B. You start losing money when the stock moves higher than the interval between strikes A and B plus the credit received.
Let’s take a hypothetical options trading example. XYZ is trading at 50. I buy 1 52.50 call paying 1.25 and I sell 2 55 calls at .75 for a .25 credit. Below 52.50 I make the .25 credit. At 55 the 52.50 call is worth 2.50 so I make 1.25 and the 55 calls expire worthless, giving me a total profit of 2.75, or $275 for every spread. Where do I start to lose money? The difference between strikes A and B in this case is 2.50. So, at 57.50 plus the .25 credit, 57.75 is my breakeven and above that I lose money.
Now let’s take an example of the 1:2 ratio vertical spread using puts.
The P&L graph is the reverse image of the call example:
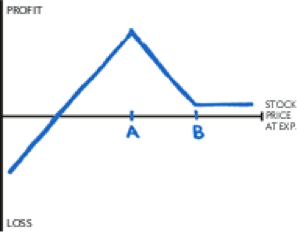
We are long one put strike B, short 2 puts, strike A. Our maximum profit is expiration at the short strike, above strike B we make the credit received and we start losing if the stock is lower than the distance between strikes A and B minus the credit received.
Now I will use a real life options trading example from July 2 at 12:05 CDT using Google (GOOG). With the stock at 883.40 I am looking at the July 840-820 1:2 vertical put spread.
I can buy the 840 put 1 X at 8.50 and sell the 820 put 2 X at 4.50 for a nice 1 point credit. Let’s breakdown possible results at expiration: GOOG above 840 makes the credit, 1. At 820 my maximum profit is achieved, 20.50, or $2050 for every time I do the spread. I lose money at a price below the distance between strikes minus the credit received, making my breakeven point 819.
Because I am net short options, the clock is on my side. However, my risk is potentially unlimited. It would not be wise, for instance, to do a 1:2 call spread if the stock is a potential takeover candidate.
The flip side of the 1:2 spread is the 2:1 where I am long 2 options and short one option. This trade has potentially unlimited profits but the clock is your enemy as the long options decay.
The P&L graph using calls looks like this:
I am short 1 X strike A and long 2 X strike B. If strike A is at the money I can probably do this for a credit. Any expiration below strike A makes the credit received. My point of maximum loss is on my long strike, strike B. This makes my breakeven higher than the interval between strikes A and B plus the credit.
Let’s use another real life options trading example using Apple (AAPL). With AAPL at 417 I can sell one July 420 call at 8.30 and buy 2 July 430 calls at 4, giving me a .30 credit. Below 420 I make .30. At 430 exactly I lose 9.70 or $970 every time I do the trade. My breakeven is 440.30. That being the distance between strikes plus the credit. And above that price I make potentially unlimited money.
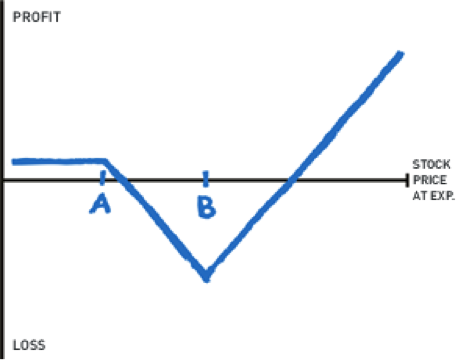
The 2:1 spread using puts looks like this when done for a credit:
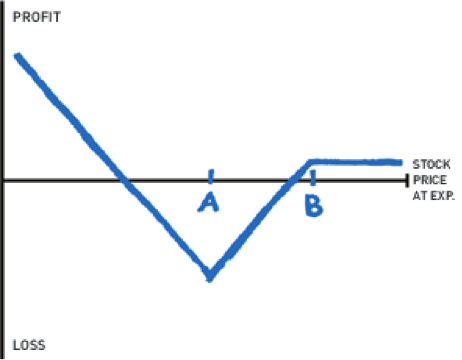
I would do this if I thought a stock was going to crash and have a resultant explosion in implied volatility. Long 2 X strike A, short 1 X strike B. My worst case scenario is expiration at strike A and my best case scenario is the stock going to zero, admittedly something that doesn’t happen very often.
Let’s use Netflix (NFLX) as another options trading example. With NFLX at 221.60 I can buy 2 July 210 puts at 3.50 and sell one July 220 put at 7.35, giving me a .35 credit, which I make on any expiration above 220. My maximum loss is expiration on the long strike (have you noticed that best case scenarios are expiration on the short strike and worst case expiration on the long strike? This is true of all option spreads) 210 is where I lose 9.65. My breakeven is 199.65 and below that I make money.
So, which do you choose, 1:2 or 2:1? 1:2 if you expect either no move or a slow and steady move to the short strike coupled with a decline in implied volatility and the 2:1 if you expect a pop in volatility coupled with a big move.
Let me conclude with this simple reminder: I am neither advising nor recommending any of the above trades. I am an options educator and not a financial advisor. I am simply illustrating once again, examples of the many and varied possible options strategies. Anyone with questions about this column or options trading should feel free to contact me via my website, www.thelissreport.com.
Twitter: @RandallLiss
No position in any of the mentioned securities at the time of publication.
Any opinions expressed herein are solely those of the author, and do not in any way represent the views or opinions of any other person or entity.


