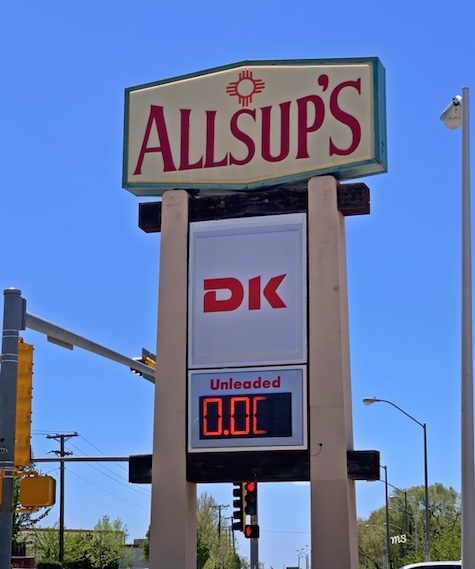
I knew that this picture would become one for the history textbooks!
A while back we pondered whether the worst of the oil market debacle was over.
Currently, that depends on a lot of “ifs”.
If OPEC adheres to its 9.7 million barrels a day
If Russia sticks to its 8.5 million bpd
If Saudi Arabia and Russia stick to their deal
If demand remains robust, thereby cutting the oil glut
If the storage capacity does not overfill

If the pandemic does not return for a second wave.
Another if depends on China and Russia.
If both countries wish to bump the US and its dominance in Europe aside, then it behooves them to keep oil prices lower.
OPEC has a meeting in June which many are looking to for more answers.
One hopes that OPEC will consider an already tenuous scenario concerning the oil glut, tanker storage issues, and a full global economic recovery.
It’s possible that if demand increases, they may start pumping more.
But if storage becomes limited, then they would be silly to do that.
Since 2015 through 2019, well before the pandemic, more than 200 North American oil and gas companies went bankrupt.
In 2020, that number has increased with 70 more going bankrupt predicted this year. And if oil heads back down to below $30 per barrel, we could see another 150-200 companies follow the bankruptcy trail.
Looking at the charts:
The US oil fund is certainly not wowing us on the technical price charts.
Brent crude oil trading at just over $35 per barrel.
In December 2019 it was over $65.
That is nearly a cut by half.
Under $30, I would be cautious if buying oil futures or ETFs. If can hold over $35, oil could see a move up towards $40-45.
Can we see $60 again?
One also must consider the ever-growing future of electric cars and TSLA.
Right now, many economies depend on oil and gas. If these countries are to compete, they might have to consider alternative energy, which would be a huge economic and global shift.
Welcome to the new world!
S&P 500 (SPY) Although the high was 302.19, SPY closed under 299.56 or the 200-DMA. 295 support
Russell 2000 (IWM) 136.85 support with 140 pivotal.
Dow Jones Industrial Average (DIA) 247.67 support.
Nasdaq (QQQ) Potential reversal pattern-A close under 228.79 tomorrow would confirm.
KRE (Regional Banks) 40 resistance 37.50 support then 36.00
SMH (Semiconductors) Also possible reversal pattern.
IYT (Transportation) 153 possible support.
IBB (Biotechnology) Disappointing move lower-looking at 128 support.
XRT (Retail) 39.28 support 40.50 resistance.


