With stocks under pressure, it is time to take a look at a key stock market index that also serves as a barometer of market strength (with more than 3500 stocks).
Today, we turn our attention to the New York Stock Exchange Composite Index (NYSE) with a long-term “monthly” view.
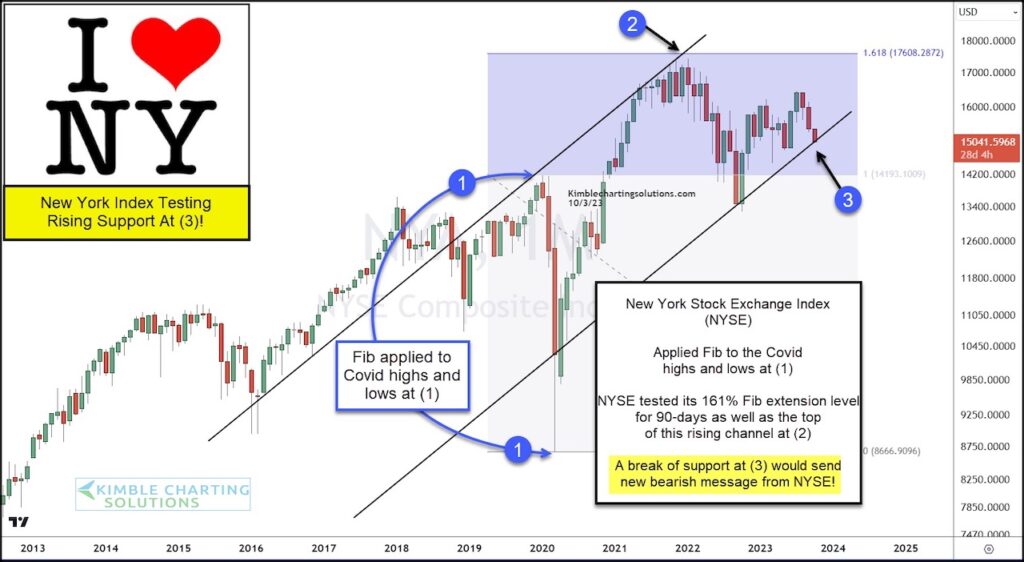
As you can see, the NYSE Composite looks to have kissed the underside of dual resistance at a key fibonacci extension level at (2). Note that this 1.618 Fib extension is calculated using the highs and lows of each (1).
This resistance held and price subsequently fell. More recently, the NYSE has found itself testing key trend line support at (3).
What this broad-based stock index does at (3), will send an important message to the S&P 500 and equity investors around the globe.
NYSE New York Stock Exchange Index “monthly” Chart
Note that KimbleCharting is offering a 2 week Free trial to See It Market readers. Just send me an email to services@kimblechartingsolutions.com for details to get set up.
Twitter: @KimbleCharting
Any opinions expressed herein are solely those of the author, and do not in any way represent the views or opinions of any other person or entity.


