It’s been a volatile couple of weeks for the stock market. And big moves have shaken out weak hands and created a day traders paradise… or demise.
Could all this volatility be a precursor to a trading low? Is the market ready for a bounce?
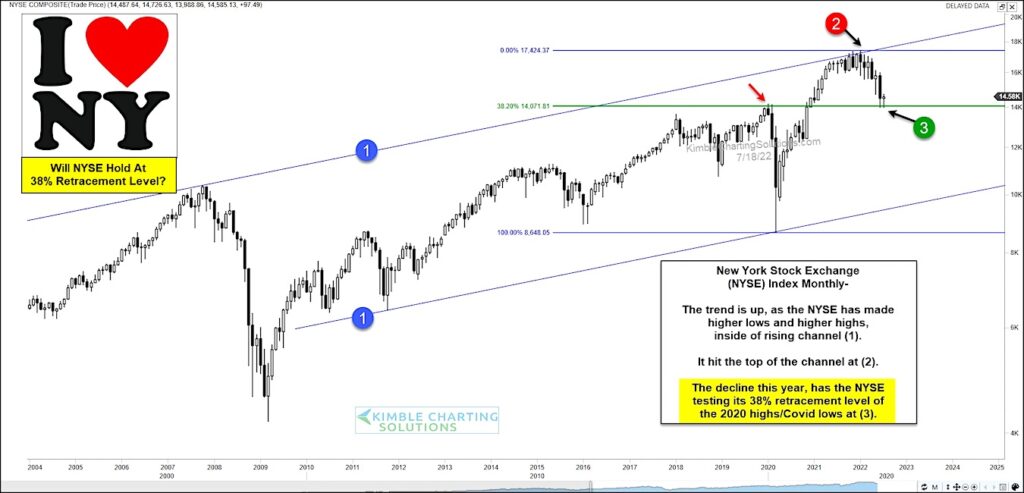
Today we look at a very broad stock market index that doesn’t get as much attention as it deserves: The New York Stock Exchange (NYSE). The chart is a long-term “monthly” chart.
As you can see, the NYSE Index has traded in a very wide ranging rising channel. And just recently, the NYSE peaked at upper channel resistance at (2).
This lead to a sharp decline that has seen the index test its 38.2 Fibonacci retracement support level at (3). Note that this price level also ties out with the 2020 high.
And at the same time, the S&P 500 Index is testing its 38.2 Fibonacci support level… so perhaps a bounce is meant to be.
In any event, this is an important price area to watch. And stock market bulls will receive positive news if the NYSE can rally off support at (3)! Stay tuned!
NYSE Index “monthly” Chart

Note that KimbleCharting is offering a 2 week Free trial to See It Market readers. Just send me an email to services@kimblechartingsolutions.com for details to get set up.
Twitter: @KimbleCharting
Any opinions expressed herein are solely those of the author, and do not in any way represent the views or opinions of any other person or entity.


