 A favorite breadth measure of technicians that’s often cited as we search for clues about the underlying quality of rallies and severity of sell offs is the net quantity of New Highs – New Lows among the 2000 or so components that make up the NYSE Composite Index (NYA).
There are lots of ways to slice the simple datum NYSE New Highs-New Lows spits out. One way discussed amidst last week’s sell off by my friends Jesse Felder and Dana Lyons is to evaluate if and where cyclical rising trends of new highs break down. Both technicians noted important trend lines on NYSE New Highs – New Lows were breached in September 2001 and July 2007, which pointed to much more challenging market environment ahead each time.
Why is this timely? A similar rising cyclical trend line broke last week, plumbing lows that are rarely ever seen and unanimously coincide with (at least short-term) bottoms.
That’s the good news NYSE New Highs-New Lows has to convey. Moreover, this measure did bounce into the end of last week. Hard, clawing back from the deeply negative numbers that broke 2009-2014’s rising trend line to finish positive. In fact, the measure finished in net positive territory by single, solitary stock.
But another application of NYSE New Highs-New Lows shows that a hard bounce – or the first hard bounce where more than one is clustered together) from this level or lower produces a short-lived relief rally and has been followed each time by lower lows. The sample space available is small, which is exactly what you would expect when working with such outlying data. Nonetheless, the message is a compelling one.
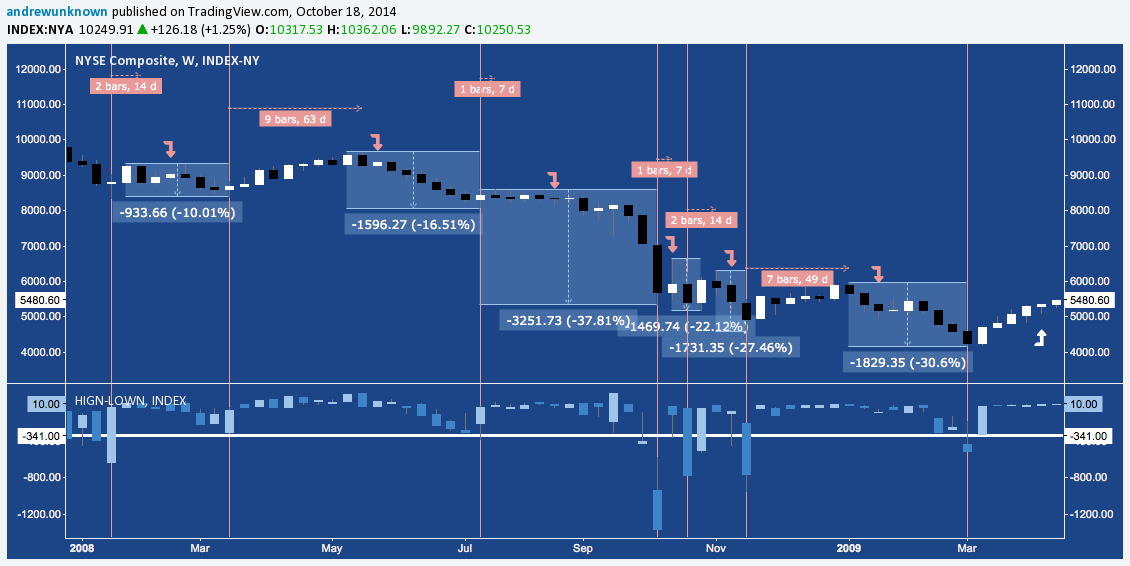
Here’s a brief overview of what has happened when NYSE New Highs-New Lows tagged the level it did last week over the major market cycles since 2000. The vertical red lines denote where the measure hit/broke last week’s level, the red horizontal line measures the subsequent bounce (if any) and the red down arrows/vertical blue rectangles measure the subsequent decline to lower lows.
2001-2002: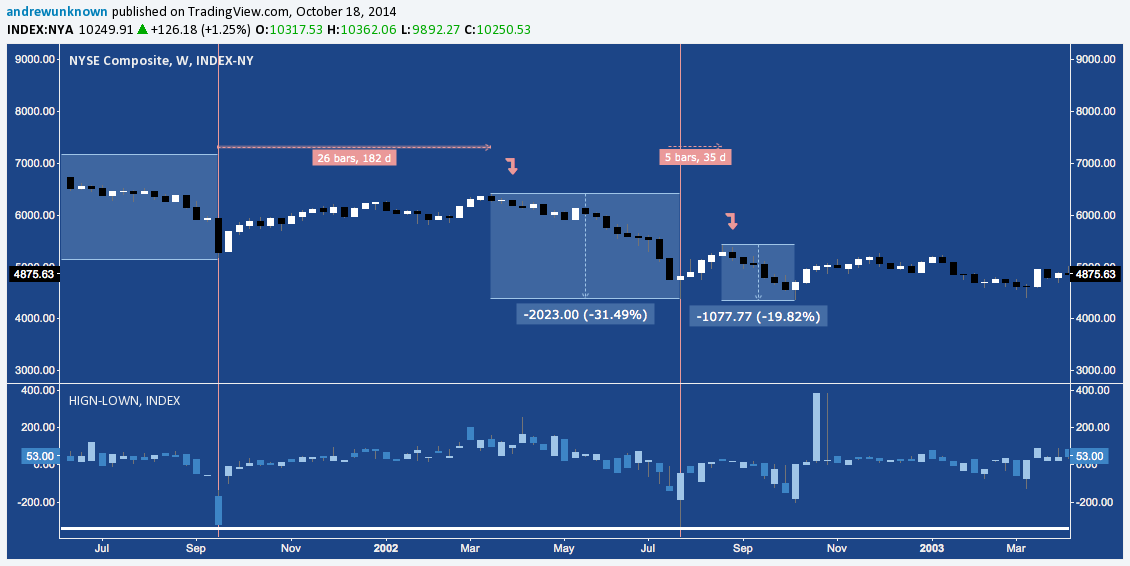
2008-2009:
2011: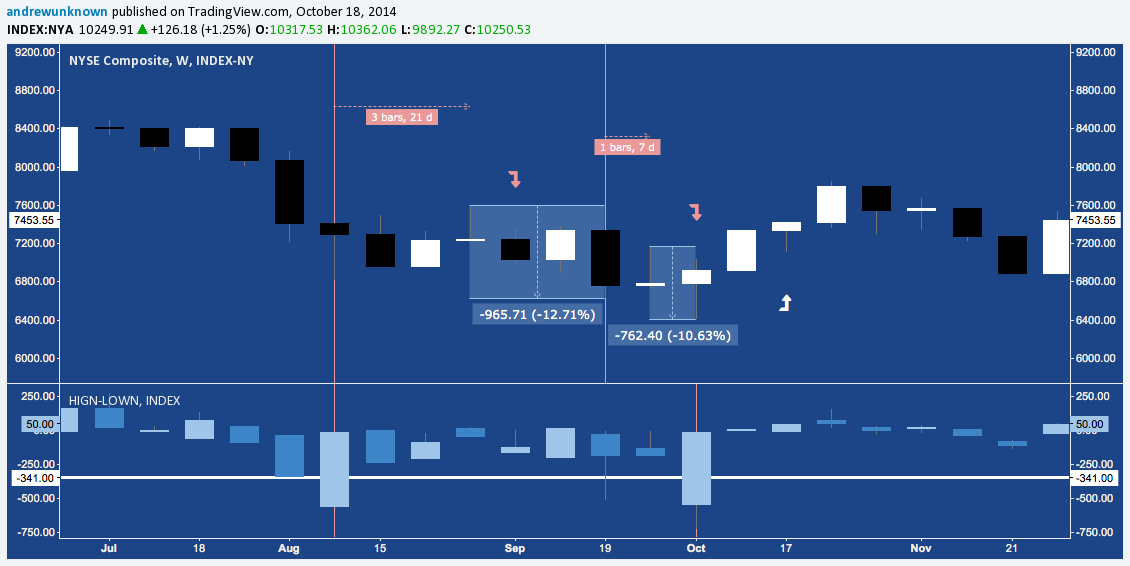
And for the broader lay-of-the-land that shows where these commonly occur:
Composite view, 2001-2014: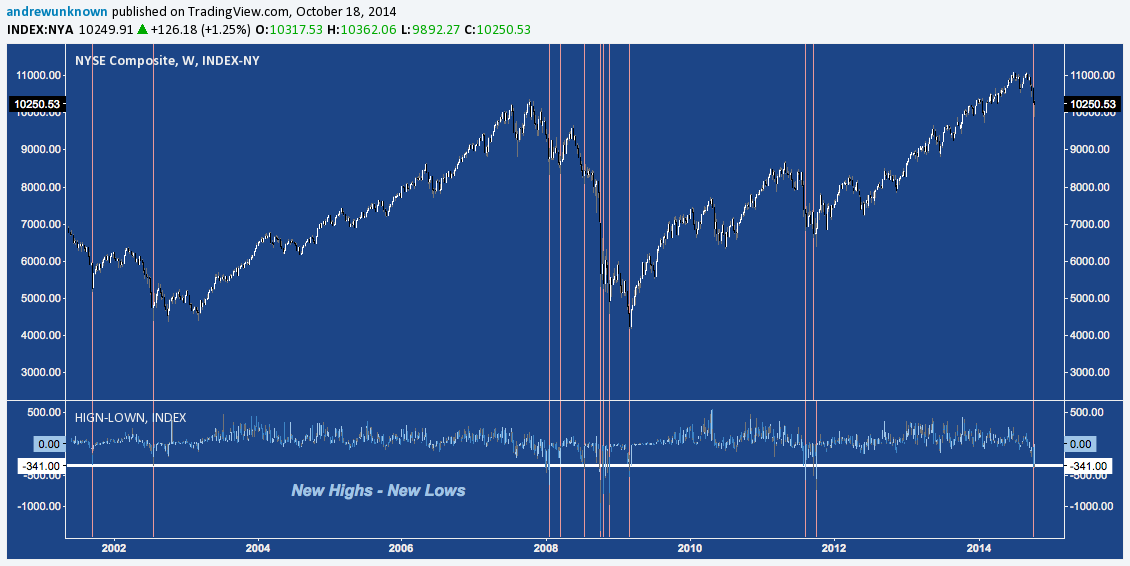
The placement of these occurrences begs the question: Where (and what) is the crisis that accompany these levels? There doesn’t seem to be one yet. Some may cite European woes, but US stock index futures bounced back hard each time Europe prompted an overnight sell off. Other suggest Ebola is creating anxiety, but in it’s latest Earnings Insight Factset notes only 1 of the 68 S&P 500 companies that have held Q3 earnings conference calls cited any negative impact from Ebola. Maybe the market zeitgeist is still acting on an intermittent and vaguely anxiety over the end of QE in a couple weeks. Whatever the case, as Andy Nyquist simply noted this week: investor psychology is fragile – even in the absence of a manifest crisis.
A technician’s response here is to ask: are we in the gap between what price already “knows” and when latent concerns coalesce into a tidy “crisis” meme that market pundits can articulate in a soundbyte? NYSE New Highs-New Lows suggests this is the case.
Of the 10 occurrences observed between 2001-2014:
- The average bounce duration is 5.7 weeks.
- The median bounce duration (which mitigates the 26-week 2001 outlier) is 2.5 weeks.
- Three bounces last 1 week or less; two lasted 1-2 weeks.
- The average subsequent decline is -19.7%
- The median subsequent decline is -20.97%
- Because every previous case occurred in a bear market (or quasi-bear, in the case of 2011), in NO case did the NYSE Composite go on to make all-time, cyclical, or even 52-week highs before further correction of at least -10%.
The current bounce now registers 0.6 weeks. Along with other technical signs such as S&P 500’s moving averages, despite – or in this case, because of – last week’s major bounce back, NYSE New Highs – New Lows suggests last week still only qualifies as a corrective rally; and makes the case lower lows in the current stock market correction are still ahead.
Twitter: @andrewunknown
Andrew holds no exposure to securities/instruments mentioned at the time of publication. Commentary provided in the above text and video is for educational purposes only and in no way constitutes trading or investment advice.


