Cautious stock analysts are towel-tossing on Nvidia (NASDAQ:NVDA).
Yesterday Suntrust abandoned its “Hold” rating established when the price was at $74, and moved to a “Buy” and a $177 price target. The stock is currently trading at $162. The numerous $180-200 price targets still make it very tempting, even as everyone but the mo-mo guys are feeling a growing sense of valuation nausea.
So who’s going to win? Should one chase the next $20-40 of upside? Or is it time to leave the party?
The answers to those three questions may well be “everyone”, “yes” and “yes”, as long as traders can match their expectations to the correct time frame.
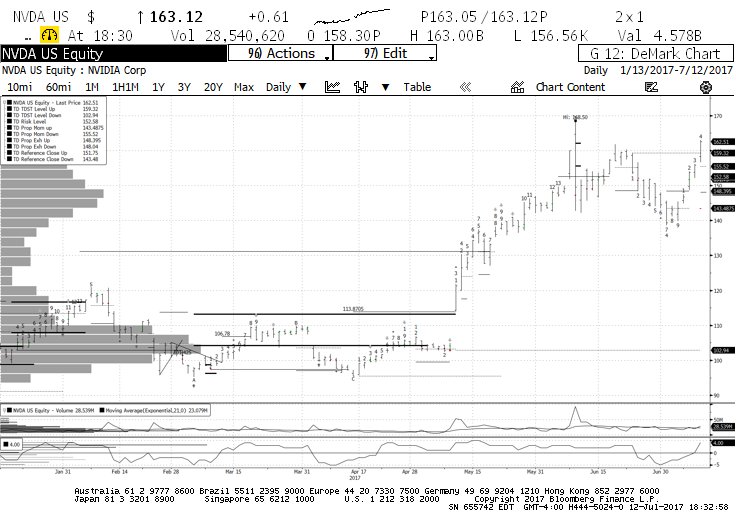
Nvidia (NVDA) Stock Chart with DeMark Indicators – “Daily”
On a daily DeMark chart, levels/counts suggest higher prices: the early June “Countdown Sell 13” resulted in a completed “TD Buy Setup” on July 6. That was the pause that refreshed and the stock is now on bar 4 of a new “TD Sell Setup”, and is already trading above “TDST Level Up”. If the “TD Sell Setup” completes and the “TDST Level Up” breaks on a qualified basis, it would be a perfect picture for more upside.
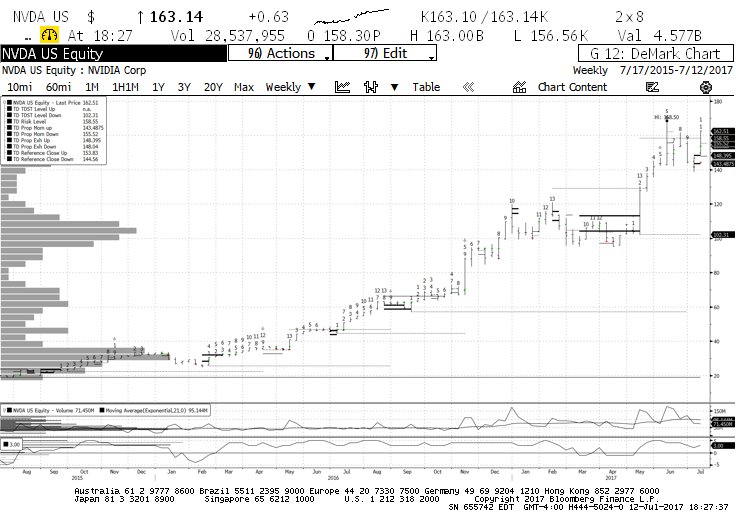
Nvidia (NVDA) Stock Chart with DeMark Indicators – “Weekly”
The weekly chart has equally bullish indicators. The “Countdown Sell 13” of May 12 was not able to interrupt the overlapping “TD Sell Setup”, and the latter completed on June 30; that laid the ground for yet another “Countdown Sell 13” to complete. Meanwhile, the “Risk Level” (secondary exhaustion) tied to the May 12 “Countdown Sell 13” has been broken – albeit not (yet) on a qualified basis. Bulls gotta be feeling good about this chart.
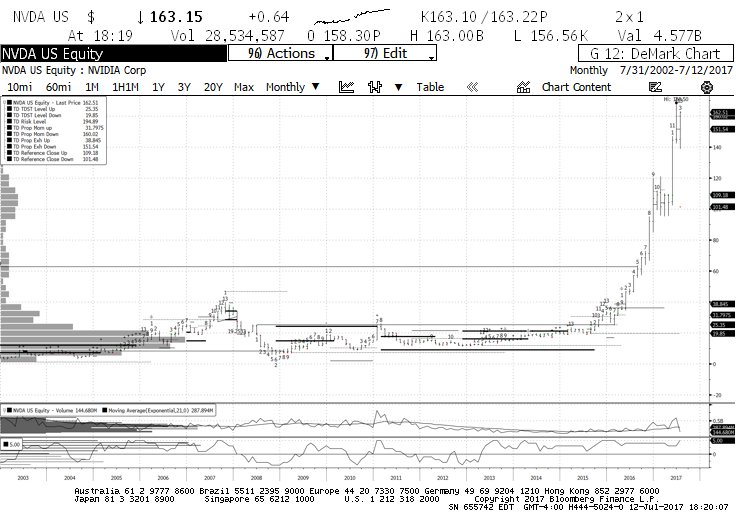
Nvidia (NVDA) Stock Chart with DeMark Indicators – “Monthly”
The monthly chart however, is what should have all shorter-term bulls keeping an eye on the exits. A July close above $144.35 will complete the “Countdown Sell 13”. The secondary exhaustion tied to this indicator will be $194.89. By itself, this should be enough to move most bulls to the sidelines sooner than later. In addition, the obvious parabolic move of the last 18 months, has pushed “TD Alignment” – an aggregation of various TD oscillators – to a max +5. The last time (and only time in the last 15 years) TD Alignment reached +5 (back in 2011), high-to-low the stock was cut in half in a span of 7 months.
Bottom line, if you are bullish or bearish on Nvidia, you can easily be right. It just depends how long you’re planning to stick around.
Charts below.
Twitter: @FZucchi
The author does not have a position in in any mentioned securities at the time of publication. Any opinions expressed herein are solely those of the author, and do not in any way represent the views or opinions of any other person or entity.

: Showing Some Signs of Emerging Strength")
