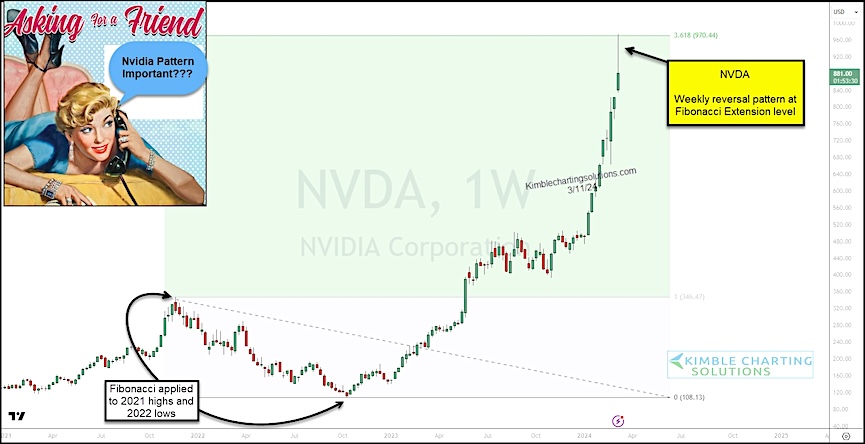
Nvidia’s stock price surged last week, reaching an important Fibonacci extension level (361.8).
The rally has been unprecedented. Nvidia (NVDA) is a large cap tech stock and its price has doubled in just 9 weeks!
But something happened last week. Nvidia’s formed a bearish reversal candle on the weekly chart. See chart below.
This is a rare pattern that often times will show up on aggressive/parabolic moves… and often times signals a trading top.
I’m wondering if this will end up being important? Stay tuned!!
$NVDA Nvidia “weekly” Stock Chart
Note that KimbleCharting is offering a 2 week Free trial to See It Market readers. Just send me an email to services@kimblechartingsolutions.com for details to get set up.
Twitter: @KimbleCharting
The author may have a position in mentioned securities. Any opinions expressed herein are solely those of the author, and do not in any way represent the views or opinions of any other person or entity.

: Worrisome to Broader Market?")

