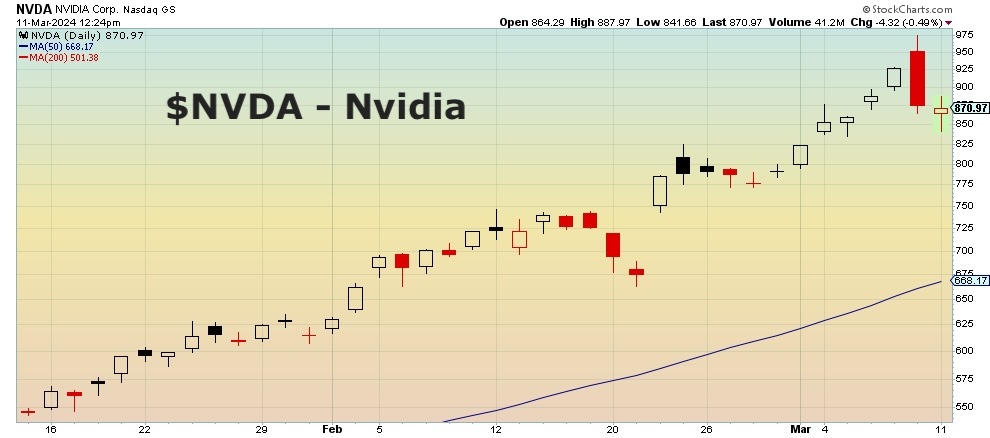
Nvidia (NVDA) has significantly outperformed the S&P 500 in 2024, up about 77% year-to-date through last Friday vs. the S&P 500 which was up only 8%. But by the end of last week, NVDA dropped the infamous “bearish engulfing pattern”, suggesting short-term distribution and a bearish setup into this week.
This two-bar reversal pattern, which signaled not only for Nvidia but for the Semiconductor ETF (SMH) as well, indicates a shift in short-term momentum.
Strong selling pressure after a higher open “engulfs” the range of the previous day, indicating an influx of profit taking and/or an exhaustion of buyers.
In either case, it usually suggests further price deterioration in the days to come.
In today’s video, we’ll break down the bearish engulfing pattern, how to identify downside targets assuming a further decline, and which levels may give an “all clear” and a potential return to a bullish uptrend.
- What does the bullish engulfing pattern tell us about a shift in price momentum, and what does that mean for NVDA?
- Why does a prevalence of bearish engulfing patterns last week indicate a potential broader decline through the month of March?
- How can we use the pattern itself to manage risk in case of a whipsaw?
[Video] Nvidia (NVDA) and Semiconductors (SMH) Bearish Reversals?
$NVDA Nvidia Stock Price Reversal Chart
Twitter: @DKellerCMT
The author may have positions in mentioned securities at the time of publication. Any opinions expressed herein are solely those of the author, and do not in any way represent the views or opinions of any other person or entity.
")


")
