Technology has become a durable and leading sector or the global economy and stock markets.
And due to a concoction of mixed economic data, over-heated inflation, and rising interest rates technology stocks have been caught in the cross-hairs of a bear market.
Today, we turn to Joe Friday for, “The Facts, Ma’am. Just the facts.”
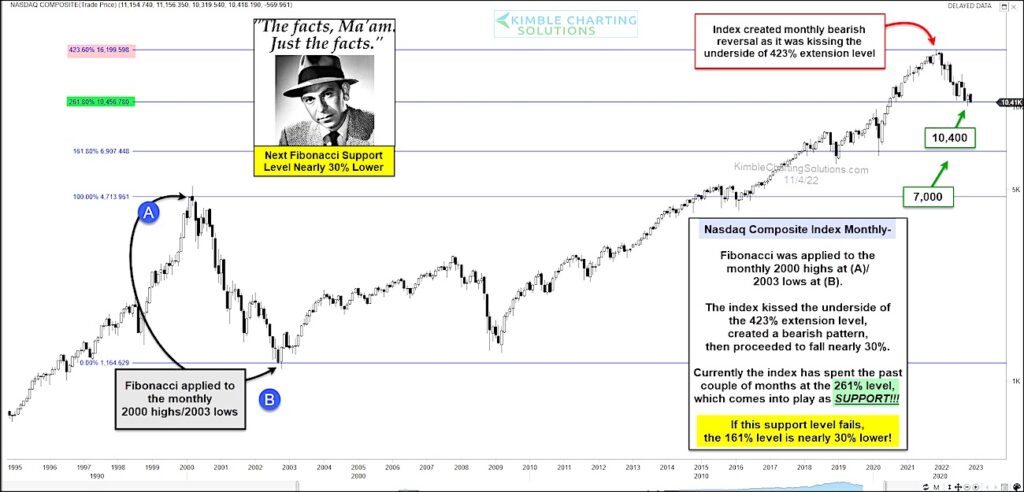
The chart below looks at the Nasdaq Composite on a long-term “monthly” timeframe with key Fibonacci levels.
As you can see, the Nasdaq rallied as high as the 423% Fibonacci extension level before reversing lower. That reversal has sent the Nasdaq sputtering down to an important/strong price support level at the 261% Fibonacci level (10,400).
IF this key Fibonacci support level fails to hold, prices could fall a considerable amount. The next Fibonacci support level is the 161% level near 7,000!
In my humble opinion, tech stocks are at an important crossroads. Stay tuned!!
Nasdaq Composite “monthly” Chart
Note that KimbleCharting is offering a 2 week Free trial to See It Market readers. Just send me an email to services@kimblechartingsolutions.com for details to get set up.
Twitter: @KimbleCharting
Any opinions expressed herein are solely those of the author, and do not in any way represent the views or opinions of any other person or entity.
 Ready To Break Out?")


 Rolling Over At Key Fibonacci Level?")
")

