THE BIG PICTURE – What’s Ahead?
The major stock market indices were unable to hold above the 10/50 ema and wound up finishing lower last week. For the week, the market leading Nasdaq Composite (INDEXNASDAQ:.IXIC) closed lower -1.2%.
While the ongoing uptrend holds above each indices 50/144 ema on the range charts, market momentum draws near to the lower Daily MML levels and open gaps.
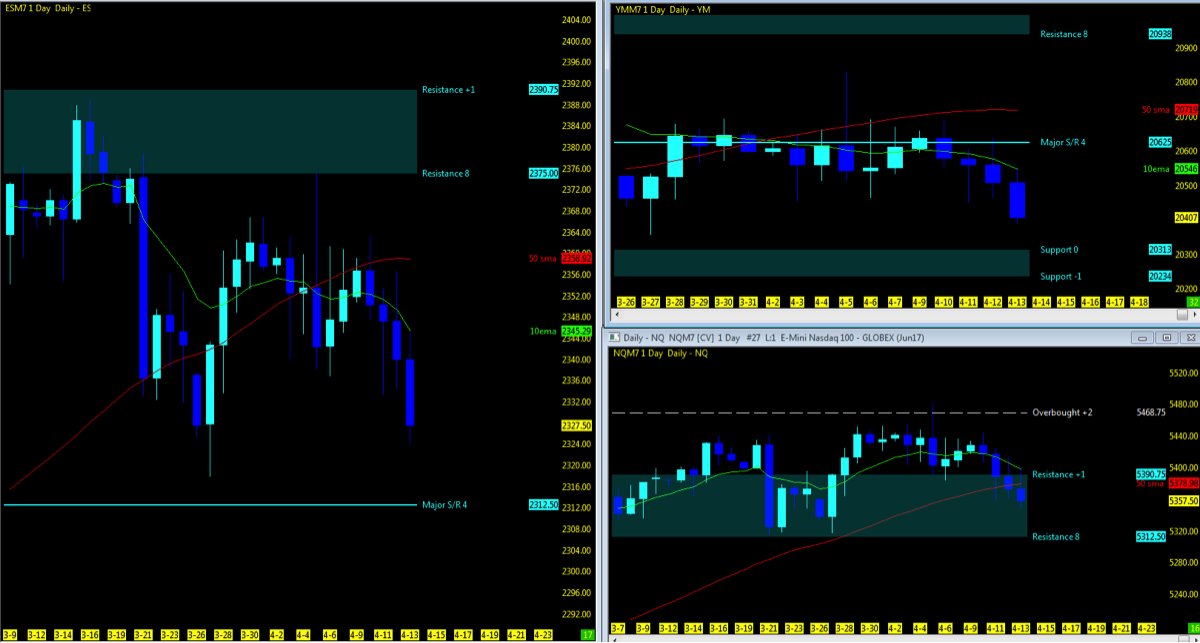
VIX levels finally catch some wind upside and managed to hit the low 16’s to close out the week in the high 15’s. Open gaps remain below as the market will return to close out these levels at whichever pace it decides it wants to. The inklings of a catalyst for pullback that I have mentioned in prior weeks have clearly made its way into the market. Overall unrest overseas and a loss of euphoric momentum of USA economic overhaul, seem to have put a stall and minor correction in the market which is not a bad thing either from a technical perspective, but concern of instability hangs over us.
The technical charts no longer in consolidation, have managed to pullback from the MML highs and while they remain in an overall trend to the upside, we definitely have a pullback in action. Looking downside as we hold under the 10 and 50 period moving averages, any continued price action down will look to the next level of MML support, open gaps below and the 200 period moving average. The 60m charts holding the lows of last week could be the sufficient level of price action downside that the market needed and we may also see a bounce back upside to the weekly VWAP and 50% pullback.
Key events in the market this week include Tax day, Multiple Fed Speakers, and Beige Book. Core Economic earnings for Q1 starts to role out this week, surely an indicator if the numbers are that great, which can also be smoke and mirrors at times. Don’t forget Washington politics and worldly imbalance to set the market in motion.
THE BOTTOM LINE
Watch for price action in between the 50 and 200ma to move in either direction. To the downside while the 200ma would be the next major level of support, downside MML levels and open gaps may be opportunities for the market to bounce upside. Upside needs to regain traction above the 10/50 ema which would initially be resistance at this point.
Technical momentum probability REMAINS in an UPTREND PULLBACK on the bigger pic. Signs of market weakness evident now after week 15. Observe the intraday on the 60/15m charts for any alert of the change in trend or continued movement upside. Keep a weekly VWAP on the 60m chart to monitor trend change as in week 15 price action managed to hold under for the most of the week. I will continue notify through social media and my daily outlook; posted 15 minutes prior to the US open of any updates throughout the week.
For the Indices ETF or long term holder, different rules may apply as quarterly re-balancing NOW PASSED and is my preference for managing such markets. Option to move trailing stops to key MML, Fibonacci or moving average levels can lock in more profit if and when a pullback may occur.
Attempting to determine which way a market will go on any given day is merely a guess in which some will get it right and some will get it wrong. Being prepared in either direction intraday for the strongest probable trend is by plotting your longer term charts and utilizing an indicator of choice on the lower time frame to identify the setup and remaining in the trade that much longer. Any chart posted here is merely a snapshot of current technical momentum and not indicative of where price may lead forward.
NQ – Nasdaq Futures
Technical Momentum: UPTREND Pullback
Using the Murray Math Level (MML) charts on higher time frames can be a useful market internal tool as price action moves amongst fractal levels from hourly to daily charts. Confluence of levels may be levels of support/resistance or opportunities for a breakout move.
CHARTS: Daily; Range; 4hr
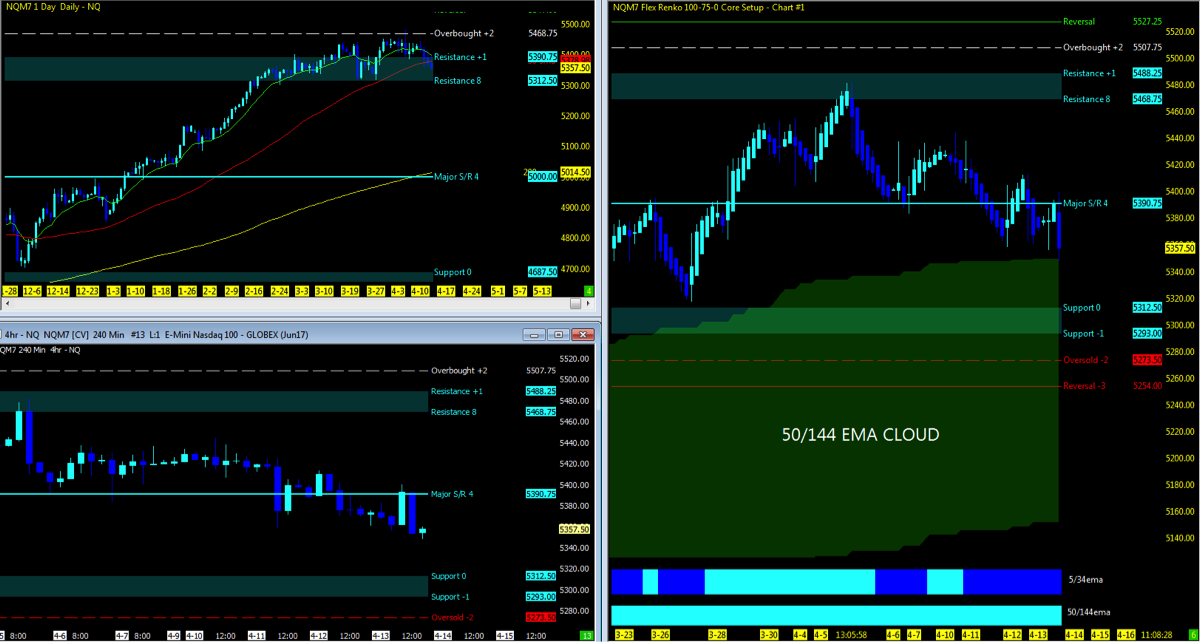
Nearest Open Daily Gap: 5232.5
Lowest Open Gap: 4017
ES – S&P Futures
Technical Momentum: UPTREND Pullback
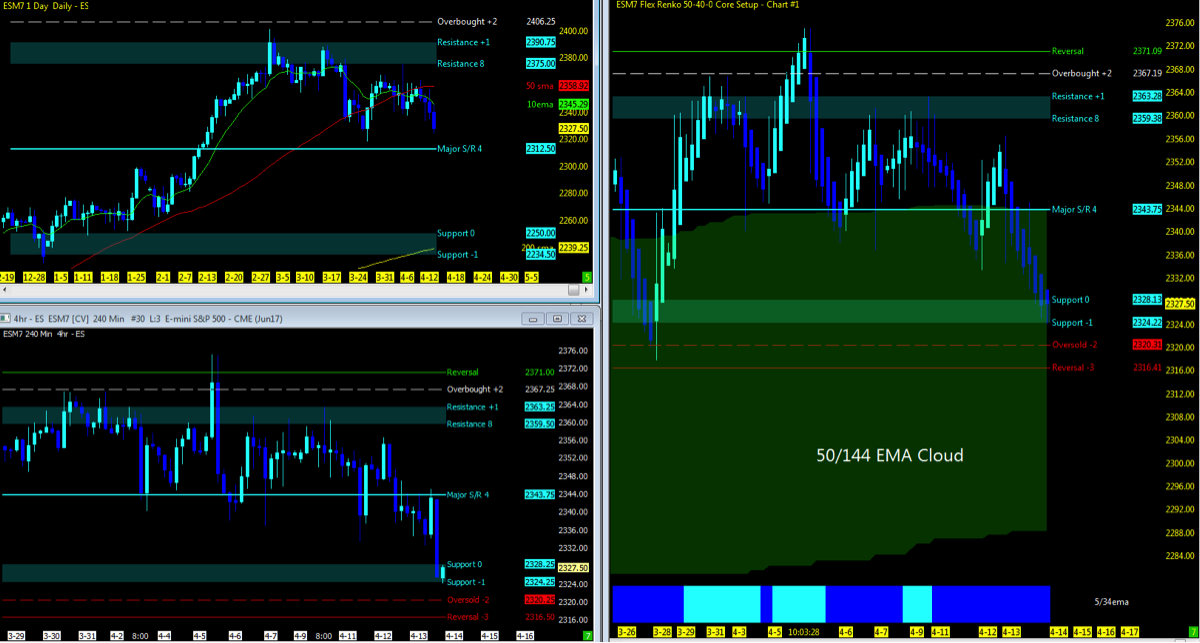
Nearest Open Daily Gap: 2315.75
Lowest Open Gap: 1860.75
Thanks for reading and remember to always use a stop at/around key technical trend levels.
Twitter: @TradingFibz
The author trades futures intraday and may have a position in the mentioned securities at the time of publication. Any opinions expressed herein are solely those of the author, and do not in any way represent the views or opinions of any other person or entity.


