The Nasdaq 100 () rallied back to new highs in December before losing momentum recently. Today, I want to look at a chart of the NQ Nasdaq 100 e-mini contract (futures).
In the chart below, you can see the strong move higher, followed by a sideways to higher consolidation. This set the index up for a nice trade (in this case to the downside).
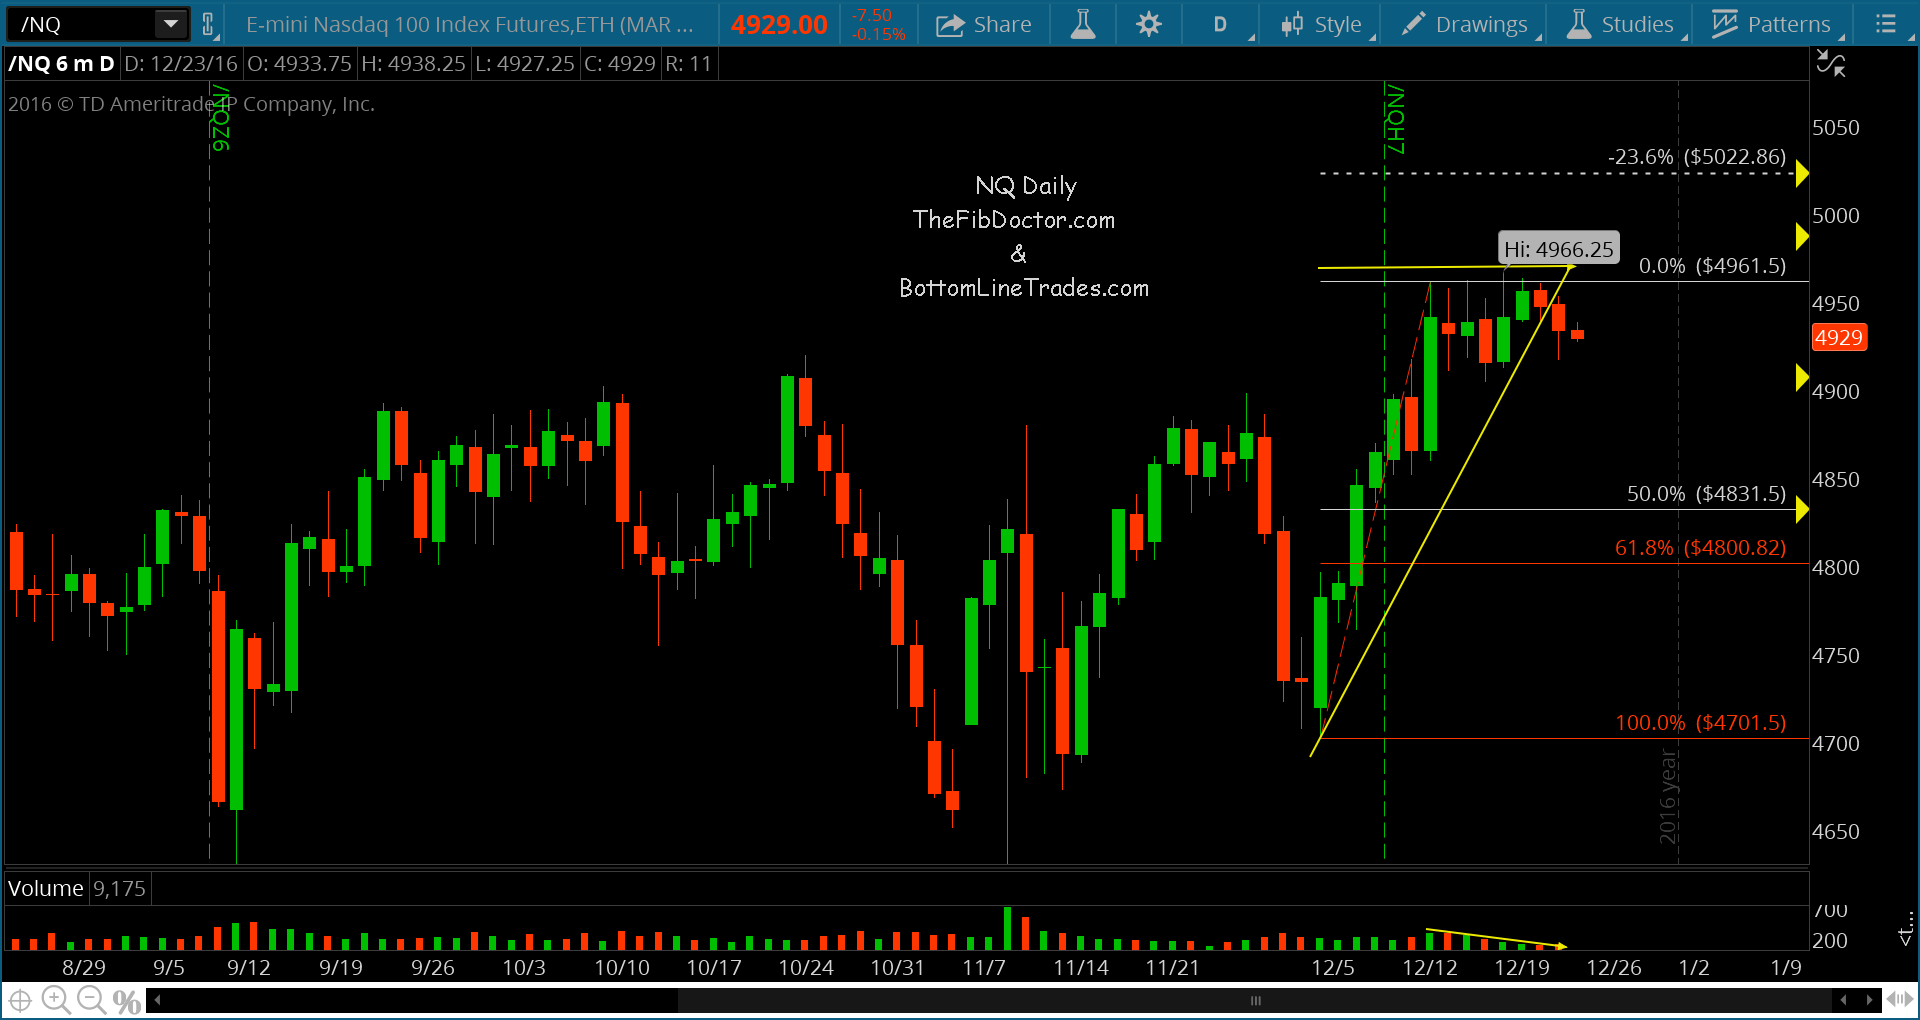
I am currently short the NQ e-mini contract for a trade and wanted to share the pattern because I thought it was interesting. You can see the triangle squeeze the price on low volume, and price breaks lower. Note that this is a short-term trading setup (given the fragment of time I’m using.
However, one should note that the index could easily backtest the uptrend while making new highs. A failure would be marked by an RSI or momentum divergence and see price fail to hold the breakout. That said, a strong move on with volume and strength would be reason to step aside. Happy holidays and good luck with trading next week and into 2017!
NASDAQ 100 E-Mini Contract Chart (NQ)
Thanks for reading. Note that you can get more of my trading insights and Fibonacci analysis at Bottom Line Trades.
Twitter: @TheFibDoctor
The author has a short trading position in NQ (Nasdaq futures) at the time of publication. Any opinions expressed herein are solely those of the author, and do not in any way represent the views or opinions of any other person or entity.


: Showing Some Signs of Emerging Strength")
