The tech wreck has been fast and furious. And considering that the stock market correction is still relatively new, we really don’t know if it will end soon or carry on for weeks/months.
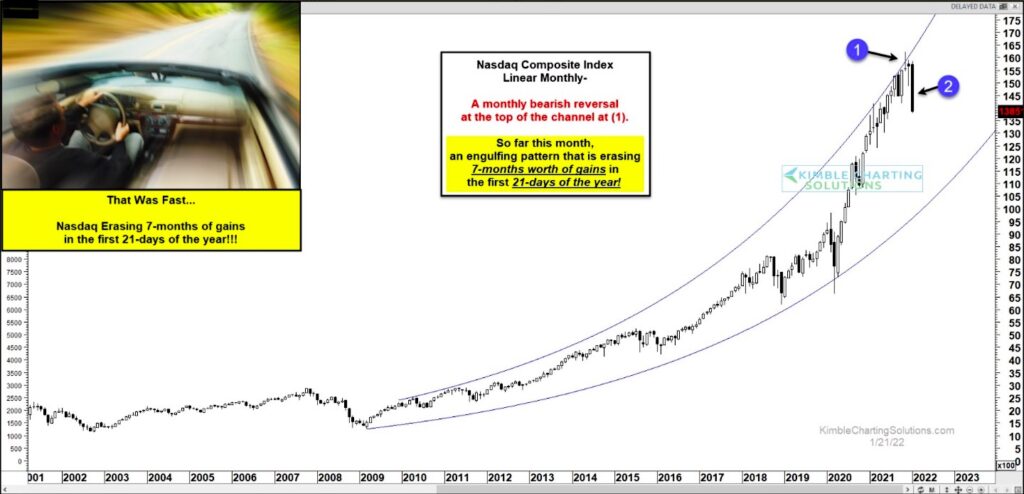
Today’s chart is “linear” and takes a long-term “monthly” view. As you can see, the Nasdaq registered a bearish monthly reversal at the top of the channel at (1).
And in the first 21-days of the year, the this broad index of technology stocks has wiped out the prior 7 months of gains!
This shows up in that gigantic engulfing price candle at (2). The selling has been fast and furious so a bounce could come anytime… but this ominous candle should at least be reason to proceed with caution in the weeks ahead.
The long-term trend is up. BUT stocks can still face severe corrections even in an up-trend. With this in mind, it is always good to mind bearish reversal patterns. Stay tuned!
Nasdaq Composite “monthly” Linear Chart
Note that KimbleCharting is offering a 2 week Free trial to See It Market readers. Just send me an email to services@kimblechartingsolutions.com for details to get set up.
Twitter: @KimbleCharting
Any opinions expressed herein are solely those of the author, and do not in any way represent the views or opinions of any other person or entity.

 Rolling Over At Key Fibonacci Level?")


