Tech stocks have had a dismal year in 2022 leading the stock market lower.
But a broad gauge of the tech universe, the Nasdaq Composite, has reached a critical support area… and all investors would be wise to take notice.
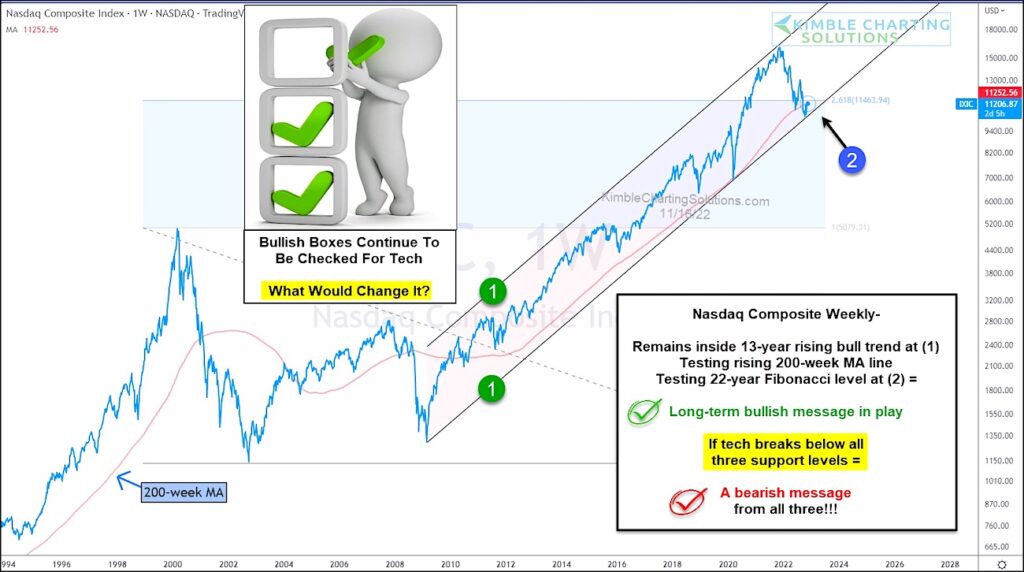
Below is a “weekly” chart of the Nasdaq. As you can see, the index has been trading within a rising trend channel marked by each (1). It hit the top of this channel in late 2021 and has been falling ever since.
Recently, the “tech” free-fall hit triple support at (2). This support is marked by the rising trend line, 200 week moving average, and the 2.618 Fibonacci price level.
If tech can check all 3 support boxes and bounce sharply higher, it would be bullish for stocks. However, if tech slips below triple support at (2), all the positives would fade away and the bear market would likely march on. Stay tuned!
Nasdaq Composite “weekly” Chart
Note that KimbleCharting is offering a 2 week Free trial to See It Market readers. Just send me an email to services@kimblechartingsolutions.com for details to get set up.
Twitter: @KimbleCharting
Any opinions expressed herein are solely those of the author, and do not in any way represent the views or opinions of any other person or entity.


