Technology stocks put in a year to forget in 2022 with the Nasdaq falling over 30 percent.
So now investors turn to 2023 and hope that tech stocks begin to perform better. Let’s just say that they will need to if the market (and economy) have any aspirations of a turnaround.
Looking at the near-term, the Nasdaq has traded sideways for several week (between 10,000 and 11,600). Something should give during the first quarter and set up another directional trading trend. Let’s look at the chart and follow the macro technical analysis and guideposts.
Note that the following MarketSmith charts are built with Investors Business Daily’s product suite.
I am an Investors Business Daily (IBD) partner and promote the use of their products. The entire platform offers a good mix of tools, education, and technical and fundamental data.
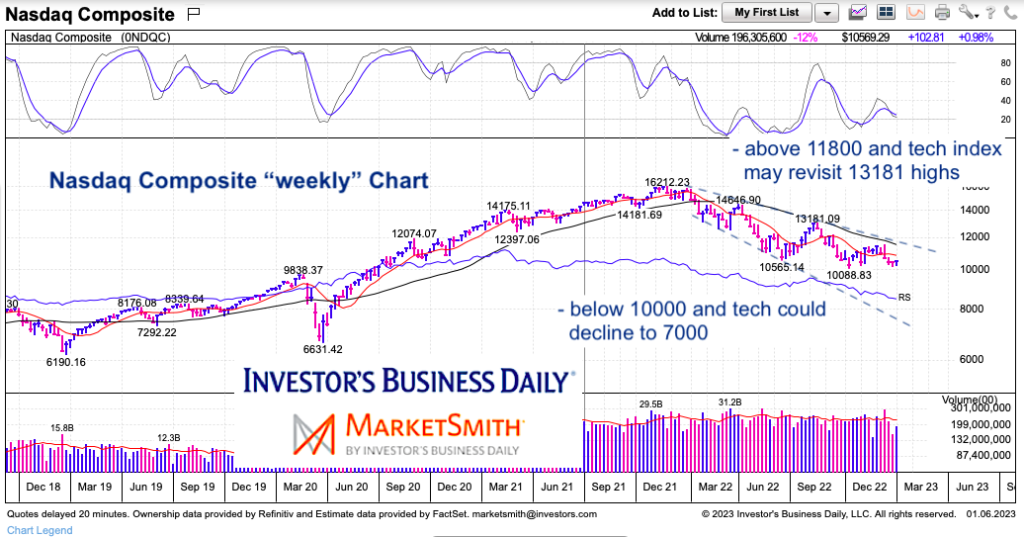
Nasdaq Composite “weekly” Chart
Here we can see that the down-trend line from the late 2021 high comes in around 11,800. We also know that the recent high was just under 11,600 (11,571). Knowing this we can place a guidepost in the area of 11,600 to 11,800 as critical resistance. A breakout over this level would neutralize the downtrend and provide for a trade higher (as well as support for out-performing stocks).
On the downside, we have technical and psychological resistance at the 10,000 level. A weekly close below this level could see a measured move to 8,500, and if sellers really come in, down to 7,000 (the down-trend support line).
Twitter: @andrewnyquist
The author may have a position in mentioned securities at the time of publication. Any opinions expressed herein are solely those of the author, and do not in any way represent the views or opinions of any other person or entity.


