THE BIG PICTURE
So What’s Ahead?
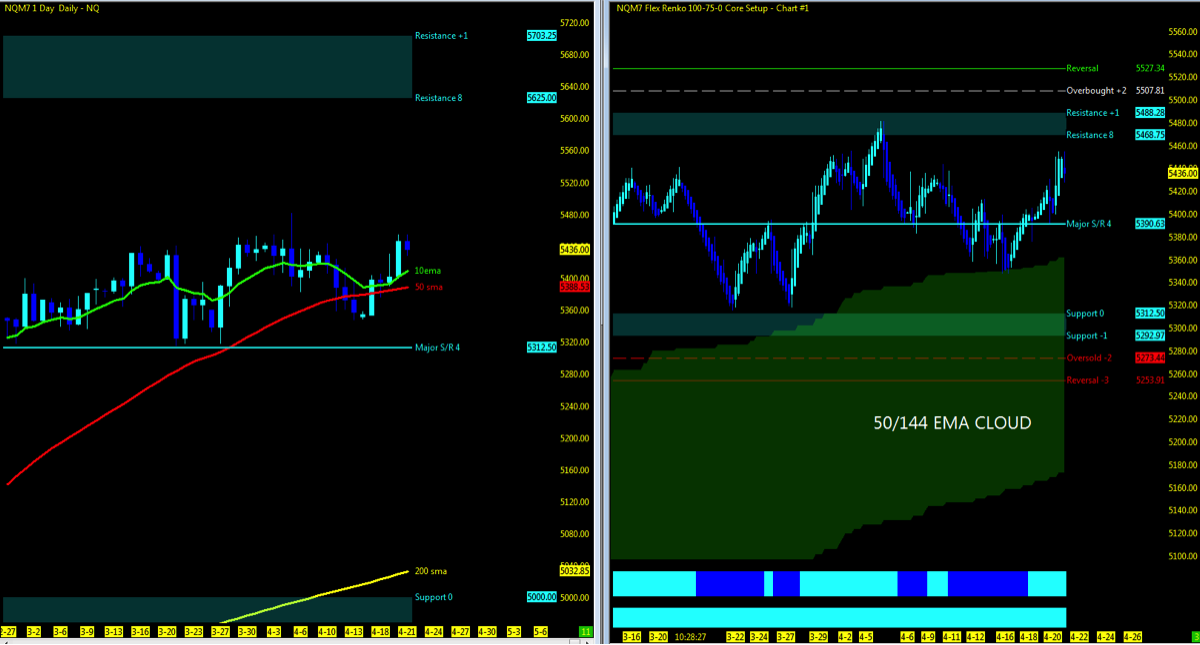
The Major Stock Market indices continue to hold above their respective 50/144 day ema’s on the range charts. The Nasdaq Futures (NQ) are leading the way back upside to all time high as it regains its hold above the 50 day ema,
VIX levels in week 16 closing out in the mid 14’s have yet to breach the upper levels above 20 or to fall below 10 indicating an outlier in momentum which would surely initiate a larger move in trend and price action in either direction. Open gaps remain below as the market will return to close out these levels at some point. What will that catalyst be to take us lower? Daily market profile appears to be balanced signifying to this trader that markets continue to find value each day and unsure of any larger move is yet to be seen.
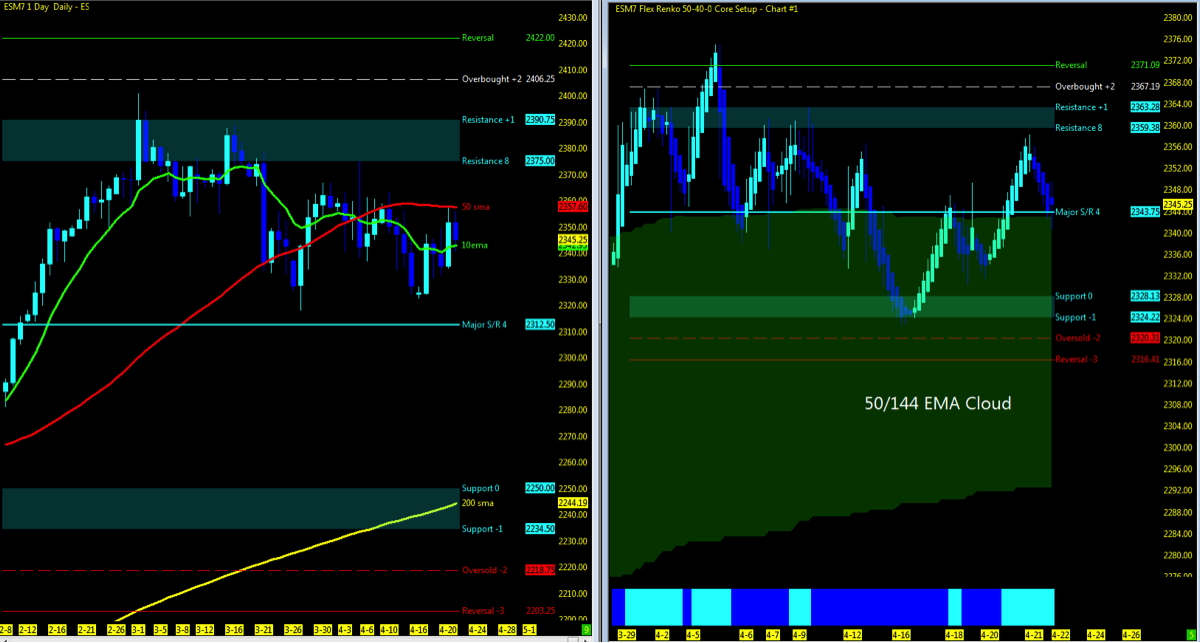
The technical charts with its move back upside on the NQ and lagging ES and struggling YM, have yet to be seen which index in the coming week will pull the others in sync. Is it enough for the NQ rally back up to pull along the ES and YM to regain its traction above the 50ma? Will it be the YM to drag down the rest with it? While the intraday 5-15 minute MML levels can offer opportunities in both directions, the 60m charts after pulling back off the MML highs to 50% pullback at the major support and resistance, price action around the 10 and 50ma will be a sign of which MML direction we are most likely to be headed to; upside resistance or downside support. In plain English; it’s decision time.
Key events in the market this week include Tax reform announcement on Wednesday, Earnings season (Thursday big day), end of month trading and GDP on Friday. Keep in mind the French political arena being closely monitored and the North Korean instability.
Note that you can also view my market outlook on YouTube. Markets Covered: ES, YM, NQ, GC, CL
THE BOTTOM LINE
Watch the price action on the ES and YM to follow through to regain traction above the 10 and 50ma. News/information on tax reform this week maybe what the market needs to move in either direction in addition to key economic data this week. Any failure here, look to open gaps, lower MML levels and the 200ma for next levels of support.
Technical momentum probability REMAINS in an UPTREND on the bigger picture. Signs of market strength evident now after week 16 on the NQ. Observe the intraday on the 60/15m charts for any alert of the change in trend or continued movement upside. Keep a weekly VWAP on the 60m chart to monitor trend change. I will continue notify through social media and my daily outlook; posted 15 minutes prior to the US open of any updates throughout the week.
For the Indices ETF or long term holder, different rules may apply as quarterly re-balancing NOW PASSED and is my preference for managing such markets. Option to move trailing stops to key MML, Fibonacci or moving average levels can lock in more profit if and when a pullback may occur.
Attempting to determine which way a market will go on any given day is merely a guess in which some will get it right and some will get it wrong. Being prepared in either direction intraday for the strongest probable trend is by plotting your longer term charts and utilizing an indicator of choice on the lower time frame to identify the setup and remaining in the trade that much longer. Any chart posted here is merely a snapshot of current technical momentum and not indicative of where price may lead forward.
Nasdaq Futures (NQ)
Technical Momentum: UPTREND
Using the Murray Math Level (MML) charts on higher time frames can be a useful market internal tool as price action moves amongst fractal levels from hourly to daily charts. Confluence of levels may be levels of support/resistance or opportunities for a breakout move.
CHARTS: Daily; Range
Nearest Open Daily Gap: 5232.5
Lowest Open Gap: 4017
S&P 500 Futures (ES)
Technical Momentum: UPTREND
Nearest Open Daily Gap: 2315.75
Lowest Open Gap: 1860.75
Thanks for reading and remember to always use a stop at/around key technical trend levels.
Twitter: @TradingFibz
The author trades futures intraday and may have a position in the mentioned securities at the time of publication. Any opinions expressed herein are solely those of the author, and do not in any way represent the views or opinions of any other person or entity.


