THE BIG PICTURE – What Lies Ahead?
Stock market bears have an opening, but it’s just a matter of whether or not they take advantage of it. Thus far, they haven’t.
The S&P 500 (INDEXSP:.INX) is just 2 percent off all-time highs, while the Nasdaq Composite (INDEXNASDAQ:.IXIC) is just one percent. The Volatility Index (VIX) continues to remain subdued swinging between 11 – 13. That said, there is a plethora of open gaps that remain below. But what will be the catalyst? Like I have said for most of 2017, it won’t take much to spook the traders to sell off at these levels.
The technical charts remain consolidated in a month that has a historical record of being bullish. While past performance is never indicative of future price action, the market “appears” to be waiting for its opportune moment to make its next move. Big picture events to keep track of include tax reform and infrastructure spending. But if either stalls out, it may take a toll on this sustained and relentless rally. Any pullback at this juncture will look to the 200ma for the next major support or for the market to regain it’s footing above the 10/50ma which the NQ appears to be in command of after three new all time highs last week.
Key events in the market this week include Jolts and a Yellen speech. Core Economic earnings for Q1 start to role out over the next several weeks, surely an indicator to be aware of. And Washington politics and worldly imbalance should play an even bigger role in Q2 2017.
THE BOTTOM LINE
CLOSELY watch price action around the daily 10/50ma on the ES/YM. If unable to hold, price action may seek support on the next MML level downside. Keep in mind open gaps below. Upside look to regain all time highs as the NQ leads the charge. Lifting and maintaining price above the 10ma will be a positive indicator of market momentum back upside.
Technical momentum probability REMAINS in an UPTREND on the bigger picture. Signs of market weakness started to show in weeks 11 and 12, but we saw strength in week 13 and consolidation in week 14. I like to keep a weekly VWAP on the 60m chart to monitor trend change as in week 14 price action struggled to pull away. I will continue notify through social media and my daily outlook; posted 15 minutes prior to the US open of any updates throughout the week.
Note that you can also view my market outlook on YouTube. Markets Covered: ES, YM, NQ, GC, CL
Attempting to determine which way a market will go on any given day is merely a guess in which some will get it right and some will get it wrong. Being prepared in either direction intraday for the strongest probable trend is by plotting your longer term charts and utilizing an indicator of choice on the lower time frame to identify the setup and remaining in the trade that much longer. Any chart posted here is merely a snapshot of current technical momentum and not indicative of where price may lead forward.
Nasdaq Futures – NQ
Technical Momentum: UPTREND
Using the Murray Math Level (MML) charts on higher time frames can be a useful market internal tool as price action moves amongst fractal levels from hourly to daily charts. Confluence of levels may be levels of support/resistance or opportunities for a breakout move.
CHARTS: Daily; Range; 4hr
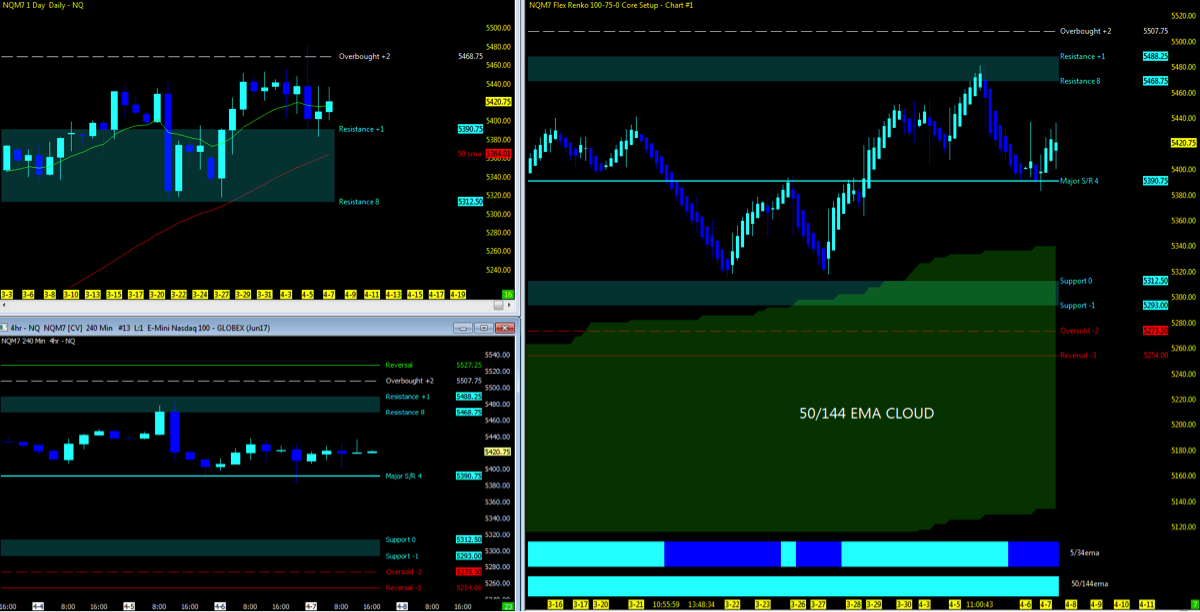
Nearest Open Daily Gap: 5232.5
Lowest Open Gap: 4017
S&P 500 Futures – ES
Technical Momentum: UPTREND
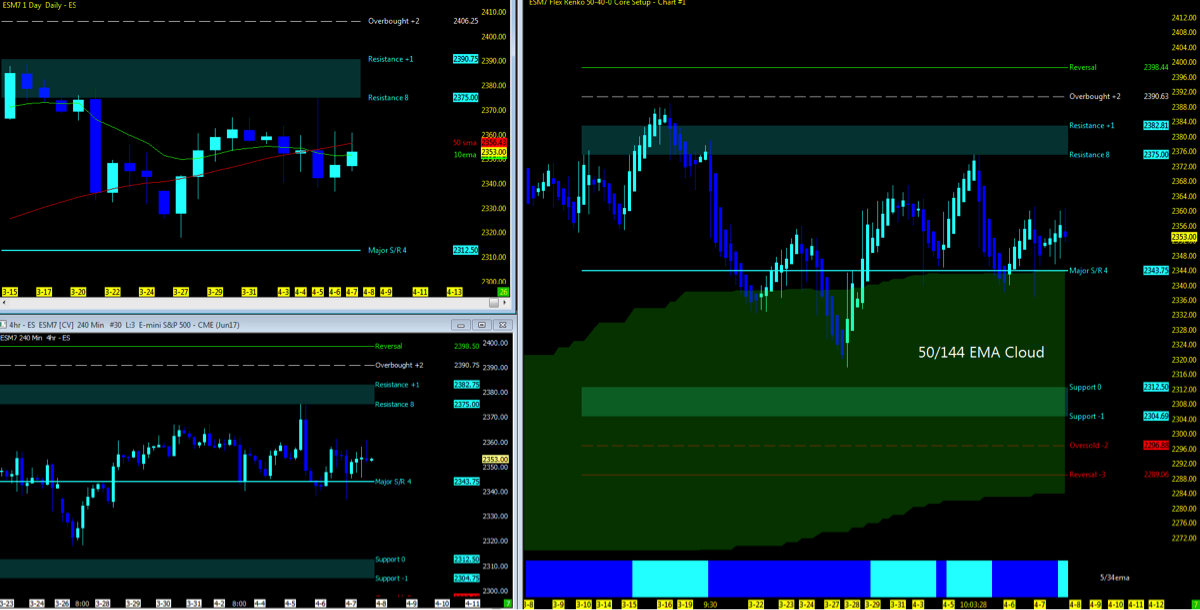
Nearest Open Daily Gap: 2315.75
Lowest Open Gap: 1860.75
Thanks for reading and remember to always use a stop at/around key technical trend levels.
Twitter: @TradingFibz
The author trades futures intraday and may have a position in the mentioned securities at the time of publication. Any opinions expressed herein are solely those of the author, and do not in any way represent the views or opinions of any other person or entity.


