 By Brad Tompkins
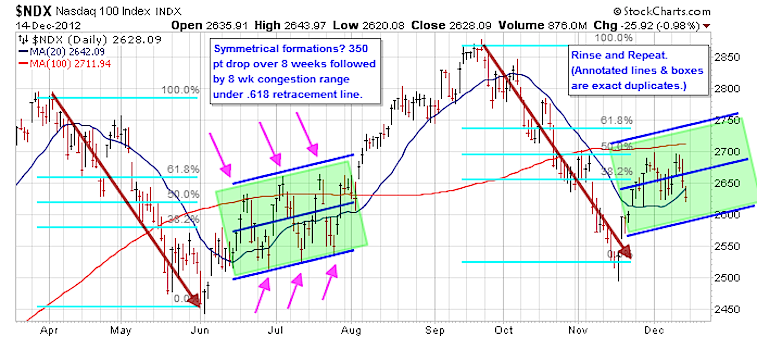
Back in September, I wrote a piece detailing the difficult trading period we experienced following the sharp drop last summer (Read: Technical Patterning Like Trying to Hit a Change Up). Well, it’s déjà vu! The current Nasdaq 100 index chart is forming an eerily similar pattern with the mirror image drop, then consolidation while the 20 day moving average curls back up to retake the 100 day moving average. See chart below.
We won’t know if the consolidation range is going to last for a full 8 weeks, but just in case let’s review a short term trading strategy that can keep you on the correct side of the chop until there is resolution either continuing the uptrend or producing a breakdown. Recall from the previous article how moving to a shorter term chart and using some simple momentum trading rules for quick, small gains can give you some cash flow while waiting for the next bigger trend move to emerge. The beauty is that you can be on the sideline (or short if you are really aggressive) while the market momentum is downward thus avoiding the pain of getting ground to pieces by a frustrating sequence of long term entry signals & stop loss exits.
It’s important to preserve your trading confidence and capital during choppy consolidations so that you are able to be come out the other side with a clear, open mind to whichever way the next market trend may unfold. Be patient and disciplined enough to accept the quick 2-3 day hits that the market allows and then step aside when the positive momentum subsides. Otherwise, if you are only looking for longer term trades, you might be best served waiting in cash until the market can muster enough energy to retake the .618 retracement line and retest highs. Confirmation of a new longer term uptrend would be price over 100 day moving average and a clear break out from the range with ultimate 20 day moving average cross higher.
Have a plan. Trade it well.
Twitter: @BBTompkins and @seeitmarket Facebook: See It Market
Position in NDX futures at the time of publication.
Any opinions expressed herein are solely those of the author, and do not in any way represent the views or opinions of any other person or entity.


