Is the Nasdaq 100 losing steam after reaching marginal new highs?
Or does it have one last move “trading” higher before a stronger pullback?
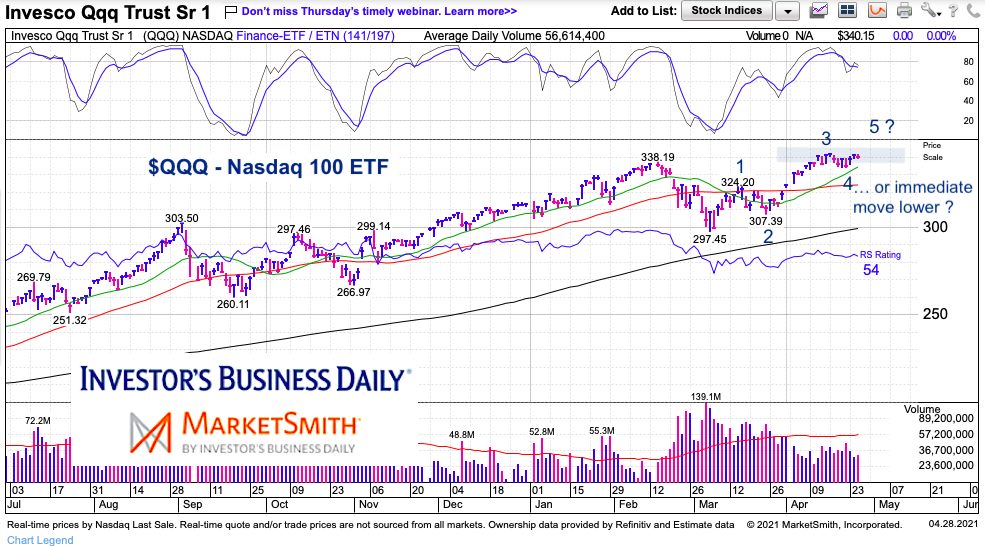
Today’s chart is a “daily” chart of the Nasdaq 100. It highlights my view that the market may be nearing an intermediate high, perhaps a bit higher. In any event, I’ll be taking caution as we move into the May timeframe.
Note that the following MarketSmith charts are built with Investors Business Daily’s product suite.
I am an Investors Business Daily (IBD) partner and promote the use of their products. The entire platform offers a good mix of technical and fundamental data and education.
$QQQ Nasdaq 100 ETF “daily” Chart
Since bottoming in early March, the Nasdaq 100 ETF (QQQ) has rallied in what appears to be 5 waves, with the 5th wave at a critical impassion. Time to head higher and squeeze shorts one more time… or immediate move lower. Watch this area right here. (and note I am an amateur with Elliott wave).
Also note that the 1.236 Fibonacci extension is at $347 and the 1.618 is at $363. Again, this is only if the Nasdaq breaks out and extends wave 5.
Twitter: @andrewnyquist
The author may have a position in mentioned securities at the time of publication. Any opinions expressed herein are solely those of the author, and do not in any way represent the views or opinions of any other person or entity.


