Technology stocks lead the stock market out of the 2009 bottom, the Covid crash, as well as the 2022 lows.
And following a strong year in 2023, the tech leading Nasdaq 100 is testing its 2021 highs to kick off the new year.
New concerns arise…
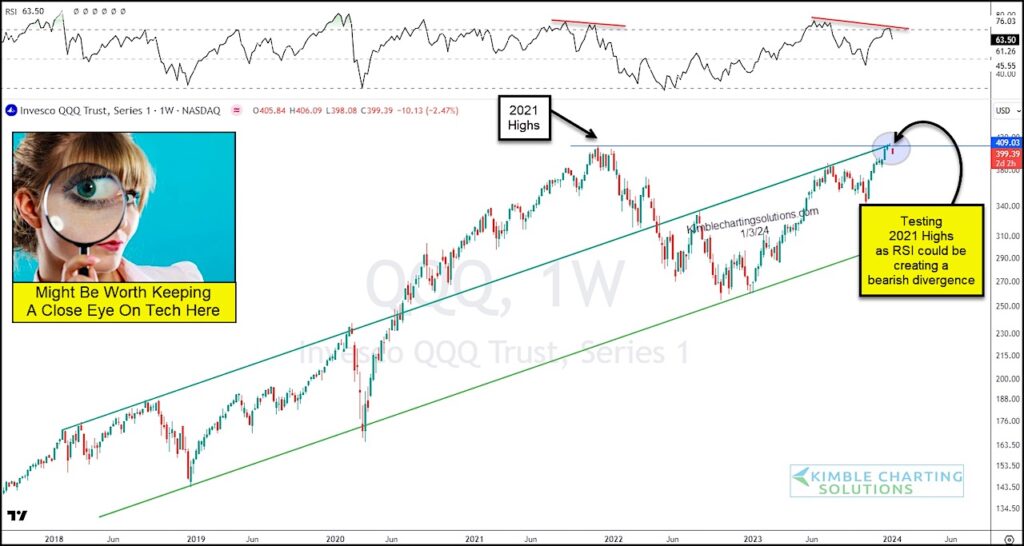
Below is a chart of the Nasdaq 100 ETF (QQQ) and we can some of the ebbs and flows of the past 5 years. But the tech index has been steadily trending higher (left to right).
BUT as QQQ tests its 2021 high, it’s also testing the upper end of rising channel resistance. It’s also important to note that its RSI indicator is making a lower high while price is attempting to turn lower.
Tech leads the market higher… and lower. So investors might want to keep a close eye on QQQ up here! Stay tuned!
$QQQ Nasdaq 100 ETF Chart
Note that KimbleCharting is offering a 2 week Free trial to See It Market readers. Just send me an email to services@kimblechartingsolutions.com for details to get set up.
Twitter: @KimbleCharting
Any opinions expressed herein are solely those of the author, and do not in any way represent the views or opinions of any other person or entity.


