Tech stocks have come charging back from the late December stock market lows.
The 5-week rally on the NASDAQ 100 (NASDAQ: QQQ) has the look of a “V” shaped bottom and has been very lucrative for those that have been a part of this trade higher.
However, if we zoom out a bit, there’s reason for caution here.
Or, at a minimum, reason to monitor tech stocks more closely here.
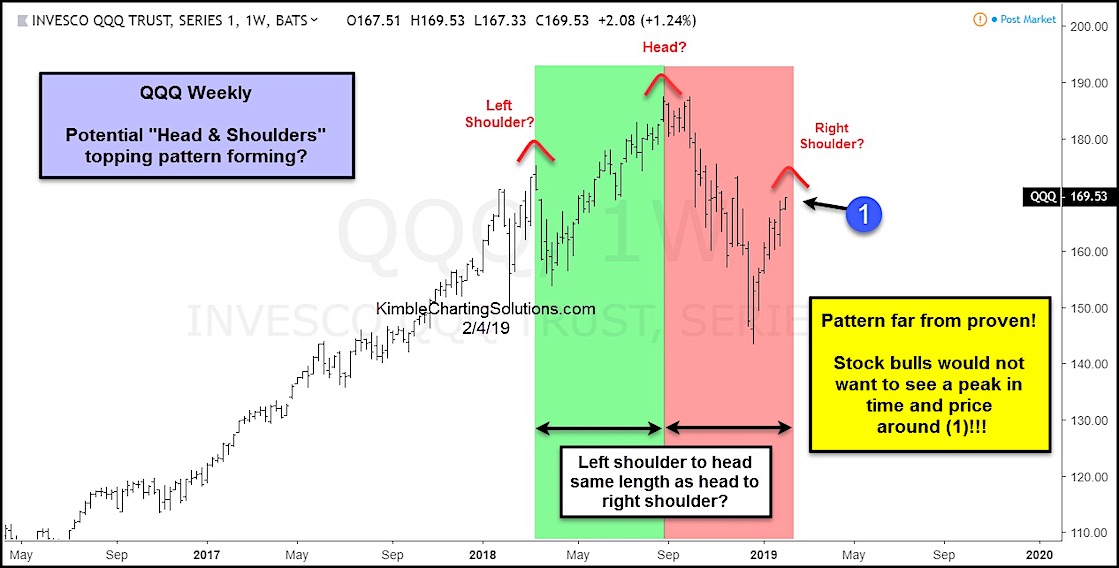
Case in point, the Nasdaq 100 (QQQ) rally is reaching up toward a resistance level that could form the right should of a head and shoulders. Now this pattern isn’t as reliable as some, but it should at least create some resistance here.
It’s noteworthy that the left shoulder to head has taken the same time to form as the head to right shoulder.
A bearish message will be sent if sharp selling takes place at (1). BUT this pattern blows up if the Nasdaq 100 breaks out above (1). Stay tuned!
$QQQ Nasdaq 100 PowerShares ETF “Weekly” Chart
Note that KimbleCharting is offering a 2 week Free trial to See It Market readers. Just send me an email to services@kimblechartingsolutions.com for details to get set up.
Twitter: @KimbleCharting
Any opinions expressed herein are solely those of the author, and do not in any way represent the views or opinions of any other person or entity.

: Showing Some Signs of Emerging Strength")
