The stock market has been plenty bullish of late. But one key tech index is telling active investors to slow their roll.
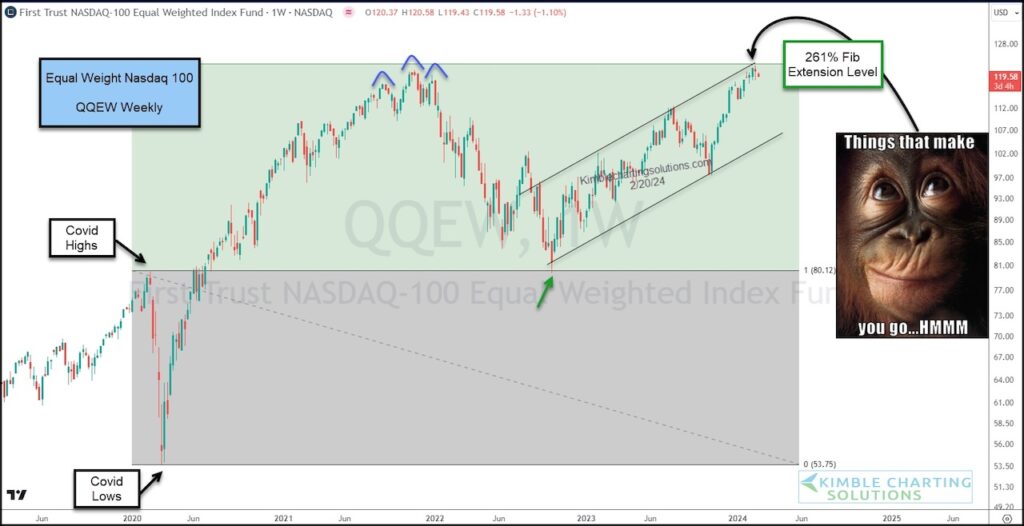
The Equal Weight Nasdaq 100 ETF (QQEW) is testing its old highs, which just so happen to also represent the 261% Fibonacci extension level.
You can see all of this on today’s “weekly” chart below.
As mentioned, $QQEW is testing its 261% Fibonacci extension level (again)… while at the top of its rising channel.
What happens here should be quite important. Breakout or breakdown? Stay tuned!
$QQEW Equal Weight Nasdaq 100 ETF “weekly” Chart
Note that KimbleCharting is offering a 2 week Free trial to See It Market readers. Just send me an email to services@kimblechartingsolutions.com for details to get set up.
Twitter: @KimbleCharting
The author may have a position in mentioned securities. Any opinions expressed herein are solely those of the author, and do not in any way represent the views or opinions of any other person or entity.


