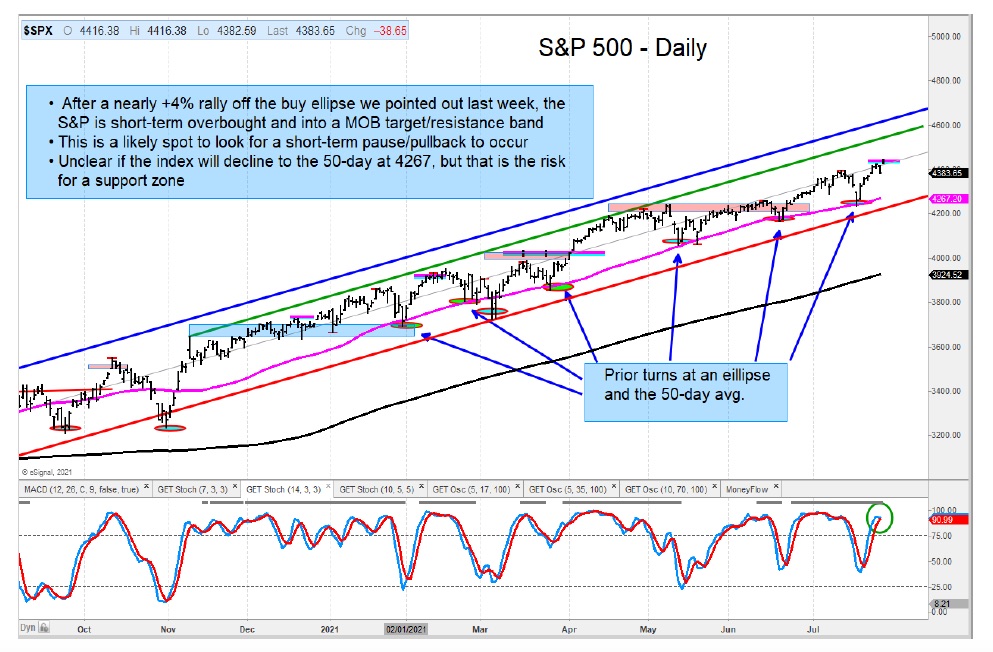
A number of stock market indices have seen 4% to 6% rallies off our MOB and Ellipse price support areas outlined last week.
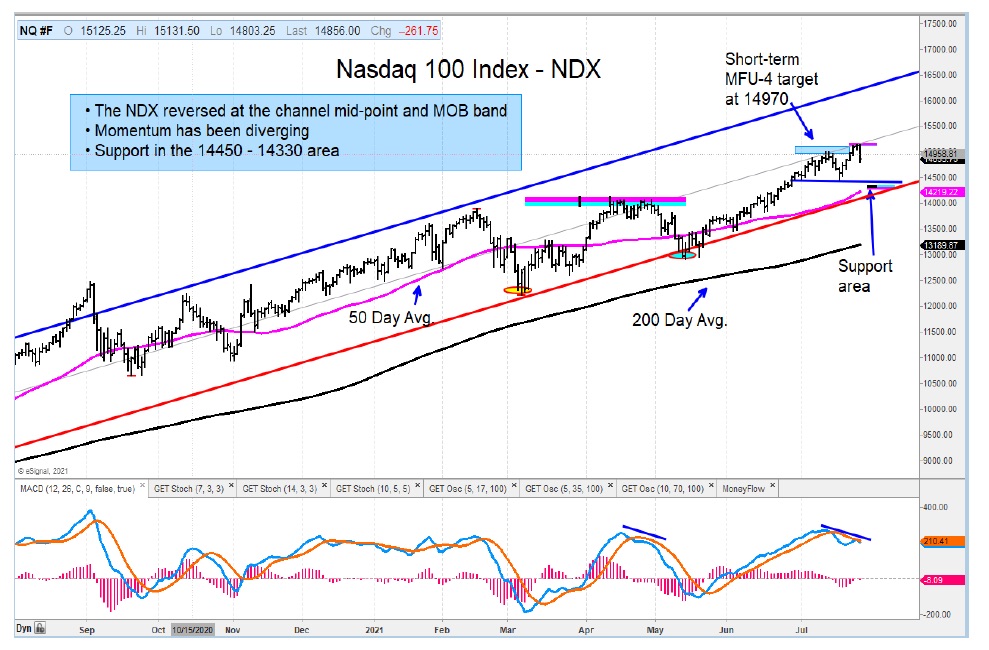
Both the S&P 500 and Nasdaq 100 have reversed from overhead MOB bands, and I expect to see a bit more weakness ahead.
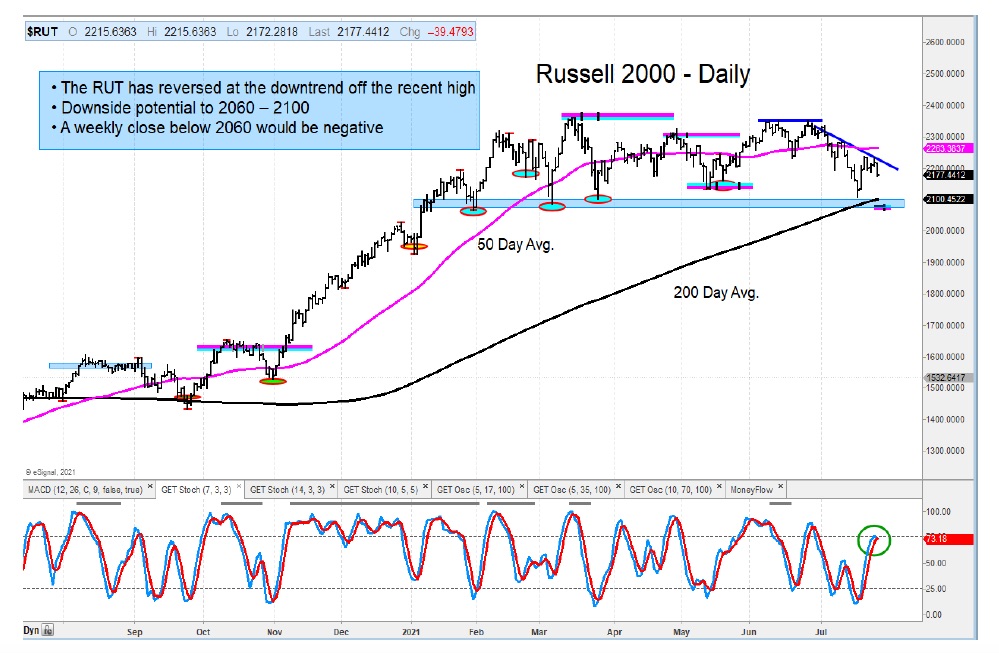
The Russell 2000 and Mid-Cap Indices have been losing momentum for months, and they look to have another leg down coming. The next price support zones are important to hold on a long-term view.
The relative performance of the S&P 500 versus the Russell 2000 continues to show a bullish configuration that favors large caps over small.
Moving away from the major indices, it is noteworthy that the Dow Transports have reversed hard from a 2+ month downtrend line. I expect another leg lower.
Both the (IGV) Software ETF and SMH have turned down from resistance targets. Critical support levels identified by both charts need to hold from here.
The Industrials ETF (XLI) has held up well. The next few days will be important to watch to see if it can push higher or break support.
The author or his firm have a position in mentioned securities at the time of publication. Any opinions expressed herein are solely those of the author, and do not in any way represent the views or opinions of any other person or entity.


