There are several indicators that investors watch to gauge the health of the market. Some use market breadth indicators, some use relative strength, some look at credit markets, and some look at other internal indicators including other stock gauges.
And some look at all of them.
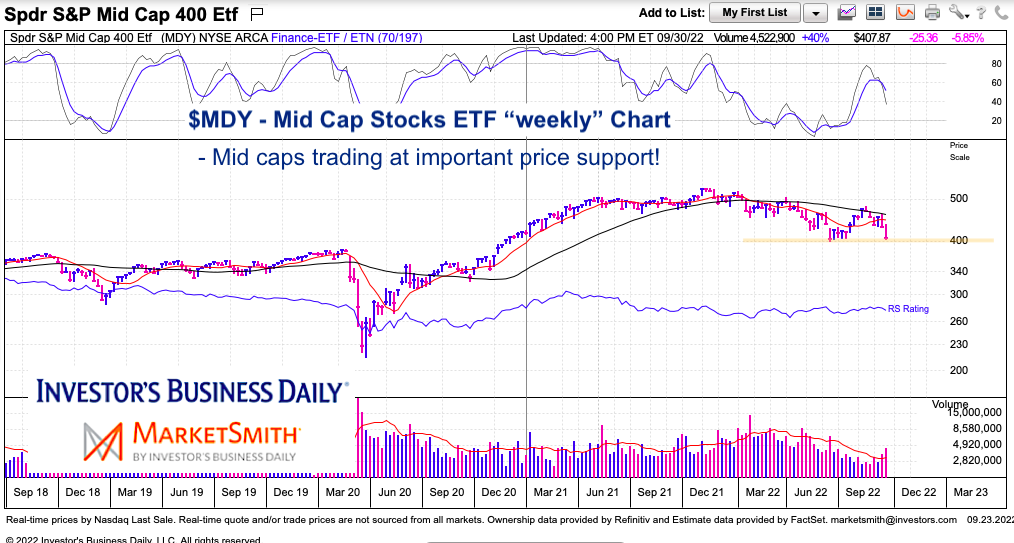
In any event, today we look at an important stock gauge that is trading at a critical price support. Hold and the market may rally. Breakdown and the market may follow suit.
The chart below is an intermediate-term “weekly” chart of the Mid Cap 400 ETF (MDY). This key section of the stock market (the middle market) needs to hold on if the broader market is going to find its footing.
Note that the following MarketSmith charts are built with Investors Business Daily’s product suite.
I am an Investors Business Daily (IBD) partner and promote the use of their products. The entire platform offers a good mix of analysts, education, and technical and fundamental data.
$MDY Mid Cap Stocks ETF “weekly” Chart
As you can see, the Mid Caps have taken a sharp turn lower of late. This has $MDY testing important price support at its 2022 lows. A strong breach of this area would be a warning to the broader market and add to the probability of a prolonged bear market.
Twitter: @andrewnyquist
The author may have a position in mentioned securities at the time of publication. Any opinions expressed herein are solely those of the author, and do not in any way represent the views or opinions of any other person or entity.


