![]() Running a close second to the Dow Transports (DJT +36.3% YTD) and Healthcare, the S&P 500’s best-performing sector year-to-date (XLV, +36.3%), Micro-cap stocks have been the place to be throughout 2013, with the Russell Micro-cap IShares ETF IWC clocking a gain of 35.75% (another virtual tie, this time with Consumer Discretionary ETF XLY at +35.73%).
Running a close second to the Dow Transports (DJT +36.3% YTD) and Healthcare, the S&P 500’s best-performing sector year-to-date (XLV, +36.3%), Micro-cap stocks have been the place to be throughout 2013, with the Russell Micro-cap IShares ETF IWC clocking a gain of 35.75% (another virtual tie, this time with Consumer Discretionary ETF XLY at +35.73%).
Judged by market capitalization, no other slice of US equities comes close: the Russell 2000-tracking Small-cap ETF IWM recorded an impressive-but-lagging +31.47%, while the S&P 500’s SPY trailed far behind at a pedestrian +24.73%. With the only comparable year (1995) instead featuring decisive large cap strength, 2013 has been a year of bottom-up bull market dominance like no other (looking to the past, and future) in our generation.
The impetus for this long, steady drive higher is plain: sensitive, pro-cyclical stocks (Healthcare is the exception, with the exogenous business cycle influence of Obamacare playing a significant role) and the smallest of companies.
Is this bottom-up strength in which Micro-cap stocks lead and Mega-caps lag a sign of cyclical market health? Many analysts think so. Investors and speculators have been willing to place their capital in beta-levered, momentum-driven issues with little hesitation. In fact, when measured against the S&P 500, IWC shows near-record relative strength, while big brother IWM has continued to struggle at its record (last seen in September 2008, May 2010 and May-June 2011) since September.
The issues with the smallest companies so monstrously outperforming the largest?
For one, it tosses the narrative of a salutary “overseas” footprint enjoyed by large-cap multinationals as the mitigating and motive force behind the current market/economy disconnect out the window (a topic for another time).
Second: micro- and small-cap relative strength flows – like margin debt or consumer sentiment – are lagging indicators of market outlook and momentum. Where the broad market context is positive, smaller stocks tends to perform best; but small stocks performing best is almost always a precursor to a negative broad market context.
In the chart below, IWC is plotted against SPY/IWC. As two pieces of the same market whole, SPY and IWC are highly correlated (always at or just off +1). Where IWC rises (i.e. when the broad market rises), it tends to outperform its large cap counterpart; and thus the purple line (SPY/IWC) goes down, showing IWC’s relative strength v. SPY. The converse relationship is generally true, too: Where large caps outperform, the wider market tends to be in defensive mode (usually going down) and the purple line rises.
The result of all this? Stocks correct as or just after micro- and small-cap strength crests. Here’s how stocks have performed where the purple line has troughed over the last 8 years:
Micro-cap Stocks: Micro v. Large Cap Performance – 2005-2013 (click image to zoom)
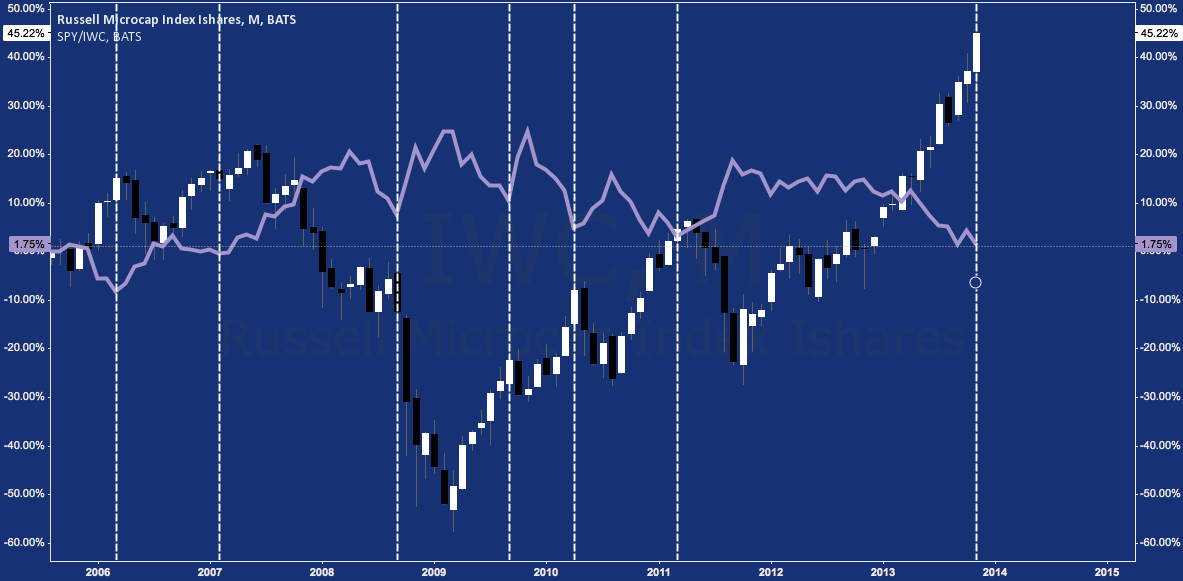
Interesting relationship; but only if one knows where small company superiority will peak. While the smallest companies can theoretically continue to outpace the larger forever, this relative strength relationship is historically cyclical and mean-reverting. As mentioned above, IWC has only been stronger than SPY once: a six-month period in late 2005-early-2006, while the Russell 2000 (IWM) has only been as strong on three occasions ever: Fall 2008, Spring 2010, and Summer 2011. Do these periods sound familiar?
Here’s IWC on a weekly timeframe. The SPY/IWC ratio above has been stripped out, and a measure of how that line correlates to IWC placed in the bottom panel. We established above that IWC and SPY/IWC generally move opposite one another because of risk appetite flows in a constructive market (because IWC grows stronger with increasing speculation and risk-taking, the line SPY/IWC favors the latter, driving it down). As a result, the correlation over time between IWC and SPY/IWC is negative: often deeply so.
Micro-cap Stocks (IWC) – Weekly: Correlation of Performance to General Market Outperformance (click image to zoom)
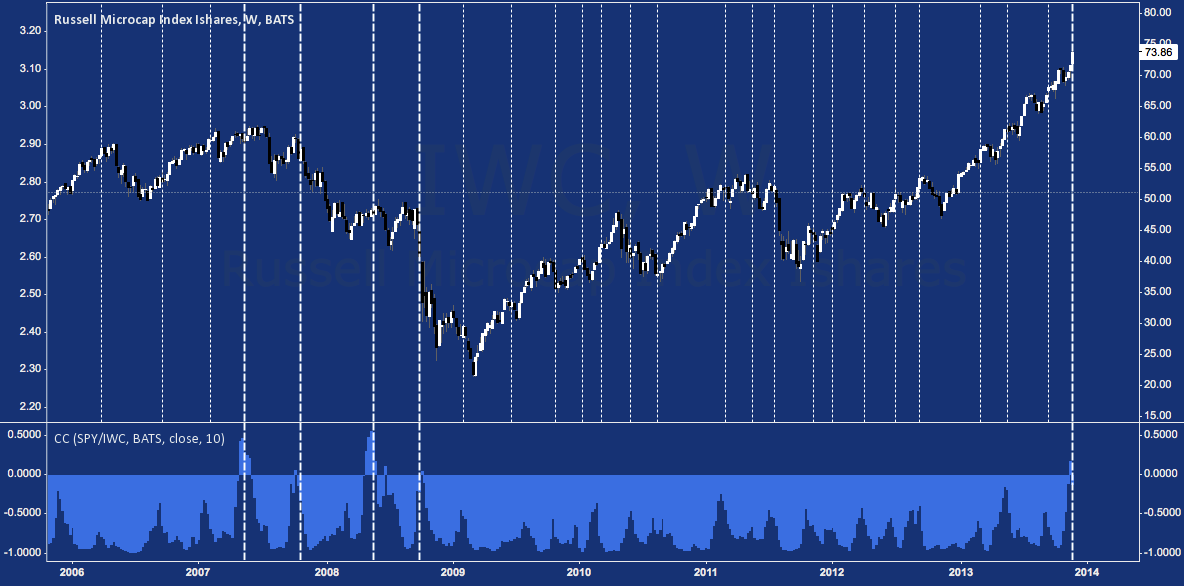
Occasionally, though, the negative correlation begins to break down. When this happens, IWC tends to underperform SPY even while it continues to move higher. It isn’t that IWC or the larger market is falling when this occurs (at least, to begin with) – only that flows are rotating toward larger companies. This look enables us to see how and where the speculative momentum driving IWC outperformance begins to deteriorate – warning us, at the very least, that risk appetite is reining in.
Where the IWC and SPY/IWC swings from deeply negative toward zero (dashed vertical lines), stocks correct. Though it is an outlying occurrence (appropriate for a year of persistent outliers), where IWC and SPY/IWC swing from deeply negative to positively correlated (thick dashed vertical lines, denoting the correlations brief peaks over o.00), stocks have been on the edge of major sell offs.
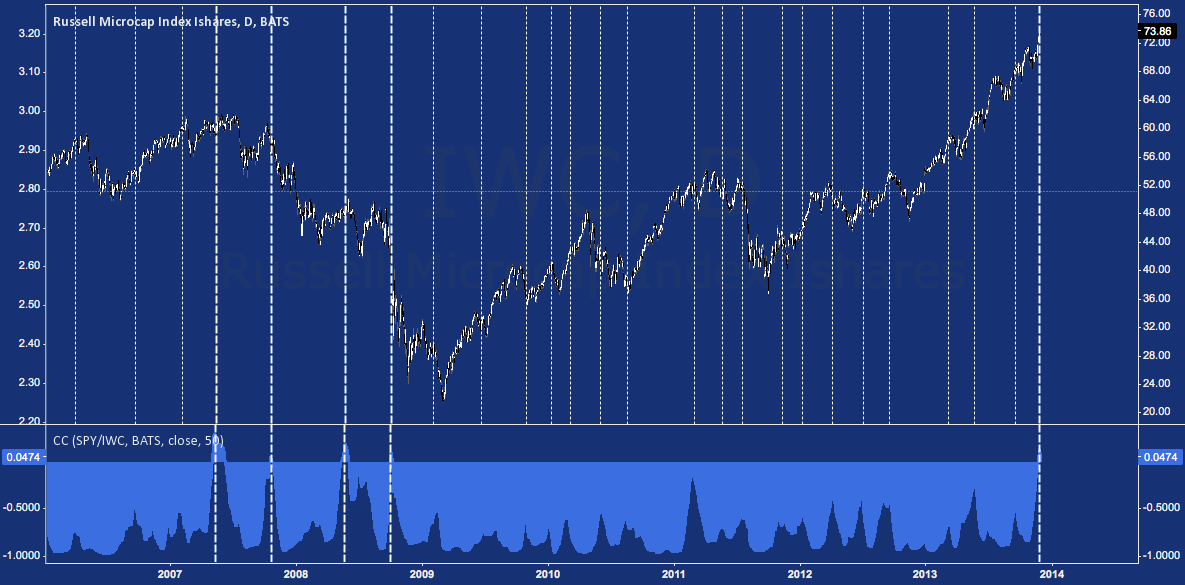
Now the same chart on a daily time frame, showing how the ebb-and-flow of this relationship dials in. Spikes higher almost always correlate with pullbacks; and occasionally kick out major corrections.
Micro-cap Stocks (IWC) – Daily: Correlation of Performance to General Market Outperformance (click image to zoom)
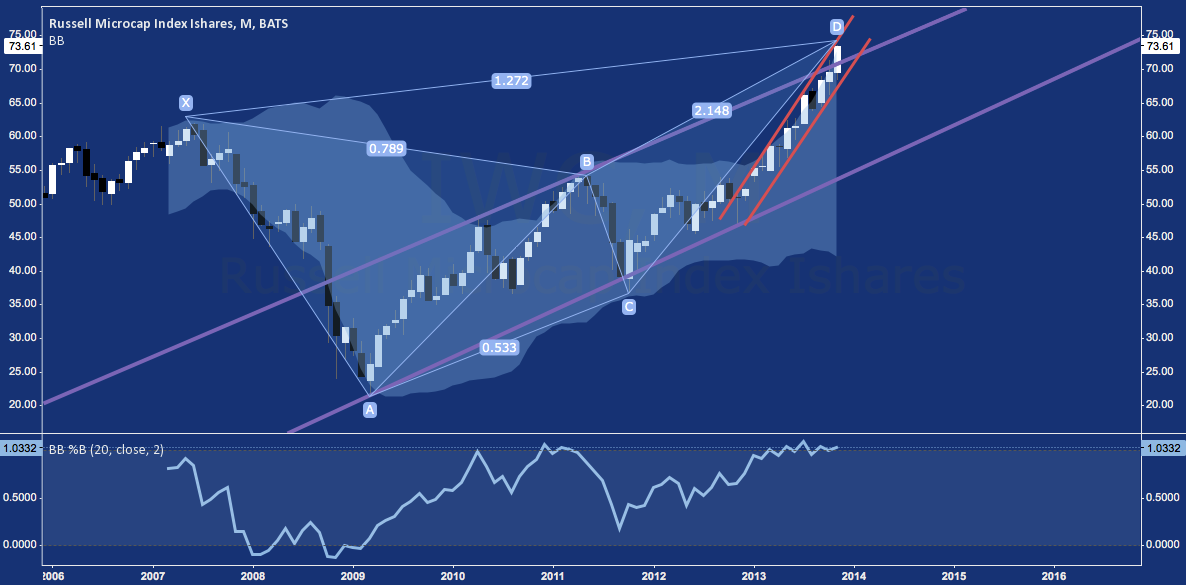
Zooming back out to the monthly, this positive IWC to SPY/IWC reading occurs in a red-lining bullish context. IWC‘s upward momentum needle has been and is buried, entering its ninth month dragging its upper 2-standard deviation Bollinger Band resulting in a %B persistently over 100. This continues to occur in a tight rising channel begin in November 2012 (orange), that has guided IWC to a breakout above its 5-year cyclical rising channel. Anyone interested in a sustainable uptrend with minimal future volatility does not want to see this proceed without a pullback. In its broadest context, this activity brings IWC to the potential reversal zone of a Bearish Butterfly harmonic pattern that has been under development since its 2007 high.
Micro-cap Stocks (IWC) – Monthly: Long Term Channel Broken to Bearish Butterfly Resistance (click image to zoom)
Micro- (IWC) and Small-caps (IWM) typify 2013 like nothing else. Relentless trend. Steamrolled volatility. Plodding, zombie-like momentum. These day-to-day realities of this market regime have been thoroughly imprinted on market observers – so much so that our penchant for recency bias can weight them as immutable laws – a genuine “New Normal”. But these aren’t eternal verities; and as the charts above show, it isn’t different this time.
Twitter: @andrewunknown and @seeitmarket
Author holds no exposure to securities mentioned at the time of publication.
Any opinions expressed herein are solely those of the author, and do not in any way represent the views or opinions of any other person or entity.


