Mexican equities have been experiencing an awful 2014, with the iShares Mexico ETF (EWW) off nearly 12% YTD. The emerging market space as a whole has been a third rail for traders – touch it and you die.
However, after heavy selling has taken place, its often time to start looking for opportunities and interesting chart setups. I think Mexican equities via the EWW is beginning to show signs that it’s ready to dust itself off and step back into the bull camp.
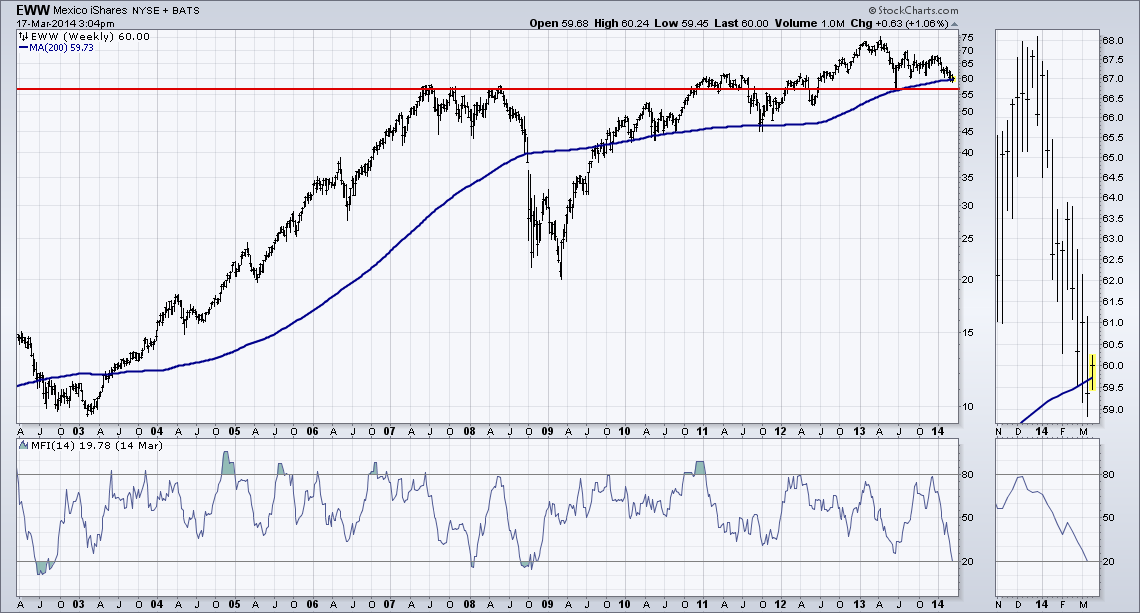
First I want to take a longer-term view of the iShares Mexico ETF (EWW). Two things stood out to me when I first started looking at the weekly chart of EWW.
First was that it’s sitting on its 200-week moving average. This MA has provided nice support during the uptrend off the 2009 lows for Mexican equities. We saw it tested in 2010, 2011, and just briefly in 2013. In the zoomed in thumbnail on the right of the chart you can see that last week we closed under the 200-week MA but have since bounced back above it as buyers came back into this country-specific ETF.
The second interesting point I noted on the $EWW chart was the near ‘oversold’ Money Flow Index (MFI). The Money Flow Index is a volume-weighted momentum indicator like the Relative Strength Index. As the chart shows, we don’t see a reading of under 20 for EWW very often. The past examples being at the end of the tech bubble in 2002, before a short pop in 2008, and near the bottom in late ’08. The market is telling us that a period of mean reversion may be due as selling volume has intensified and may be exhausting itself.
Next let’s look at the daily chart for EWW. Here we can see a positive divergence has developed in the Relative Strength Index. As price has been making lower lows over the last few months, the RSI indicator broke under 30 and then began making higher highs – diverging from price. However, the momentum indicator is still in a bearish range for the Mexican equities ETF.
We haven’t seen an ‘overbought’ reading of 70 or greater in over a year – meaning buyers haven’t been rushing into this ETF for a quite a while. This means that if we do see a bounce in Mexican equities, it’s likely to be shorted-lived based on the current data we have available. Another lower low in price is possible, but it seems some form of a bounce is due.
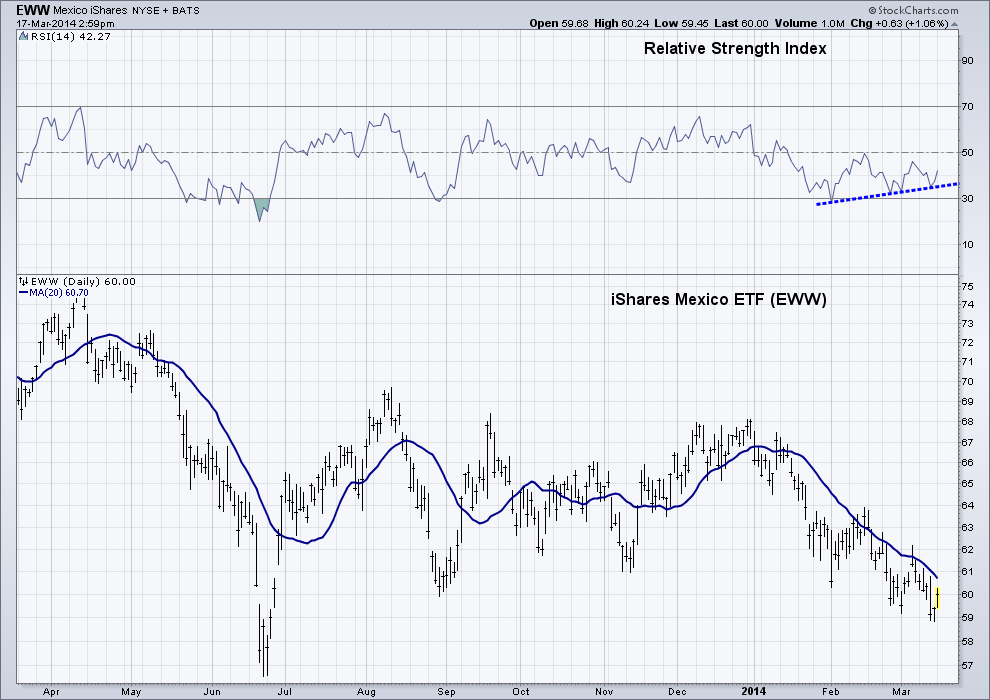
I would like to see EWW break above its 20-day moving average as a bullish sign that buyers are in fact showing greater interest. Although, if price does continue to weaken from here and we see a break of the 200-week moving average mentioned earlier, then I’ll be watching the 2013 low as potential support. This low also happens to align with the 2007/2008 high as show with the red line on the weekly chart shown. A break of $55 tells us we are wrong and the Mexican bear is still in charge.
Disclaimer: The information contained in this article should not be construed as investment advice, research, or an offer to buy or sell securities. Everything written here is meant for educational and entertainment purposes only. I or my affiliates may hold positions in securities mentioned.


: Showing Some Signs of Emerging Strength")
