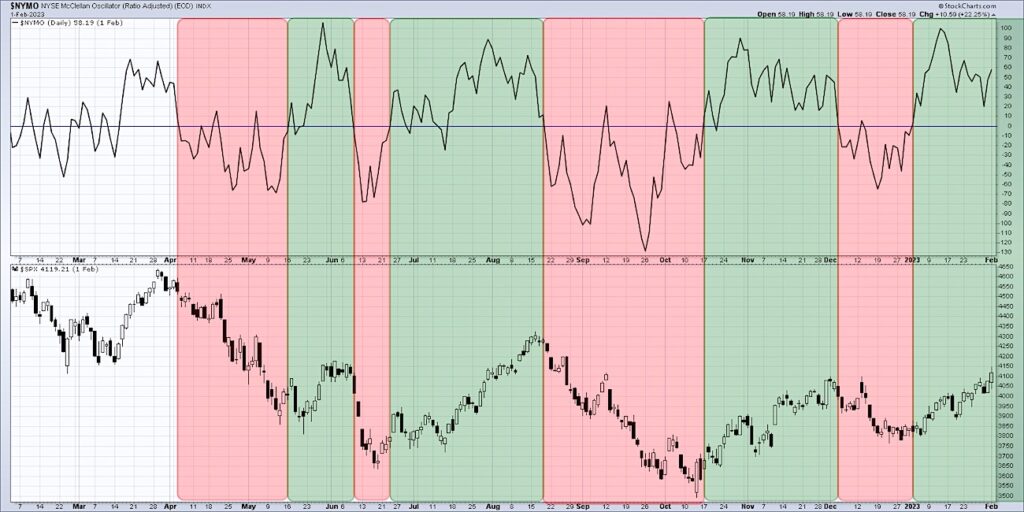
An indicator based on advance-decline data can be an ideal way to measure the underlying strength of market trends by gauging participation. One such indicator, the McClellan Oscillator, turned bullish in December suggesting that the higher low for the S&P 500 Index was just the beginning.
Daily advance-decline data can be helpful in that it confirms how many stocks closed up or down on one particular day. But the real benefit comes when you turn this daily feed into a cumulative indicator by keeping a running total of the daily readings. Now we can see the trend in advance-decline data over time.
Sherman and Marian McClellan improved on this simple breadth indicator by taking two exponential moving averages of the A-D line and plotting the difference as an indicator which we now know as the McClellan Oscillator. When the indicator is above zero, conditions are bullish. When it dips below zero, that suggests the recent bullish trend may be reversing lower.
In today’s video, we’ll show how we used the McClellan Oscillator and its companion indicator, the McClellan Summation Index, to confirm bullish conditions for stocks in the new year.
- How does the McClellan Oscillator measure participation, and what can we conclude from the McClellan Summation Index making new highs?
- Why is this indicator calculated on an equal-weighted basis, instead of a cap-weighted basis like the S&P 500 index?
What would these indicators do to suggest an impending reversal after such a strong January for stocks?
Video – McClellan Oscillator Analysis
Twitter: @DKellerCMT
The author may have positions in mentioned securities at the time of publication. Any opinions expressed herein are solely those of the author, and do not in any way represent the views or opinions of any other person or entity.

: Showing Some Signs of Emerging Strength")

