Most materials and hard commodities related stocks have performed well lately.
Today we look at the S&P Materials Sector ETF (XLB) to highlight the rally… and why it may be in need of a pause that refreshes.
XLB appears to have fulfilled an A-B-C measured move. Let’s take a peak at the chart.
Note that the following MarketSurge charts are built with Investors Business Daily’s product suite.
I am an Investors Business Daily (IBD) partner and promote the use of their products. The entire platform offers a good mix of tools, education, and technical and fundamental data.
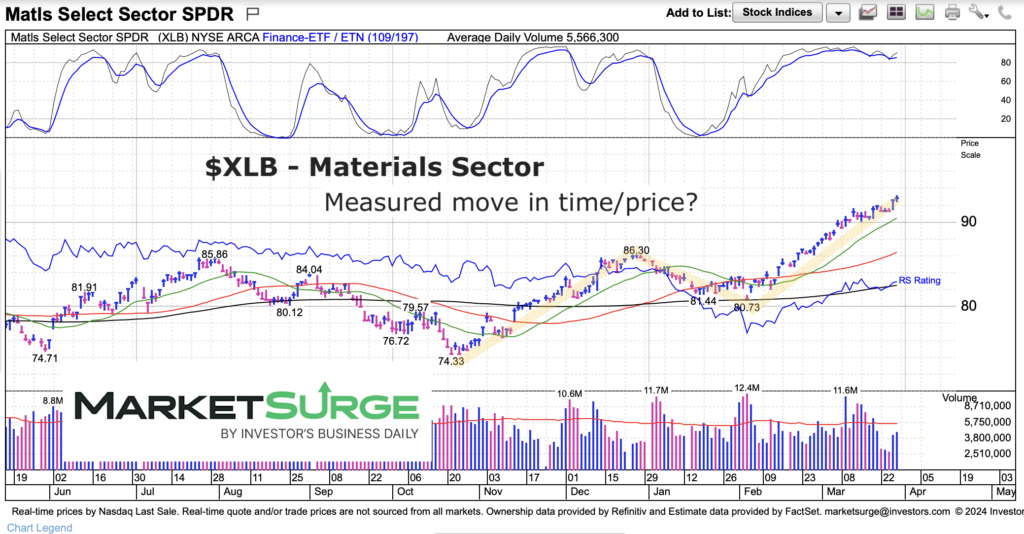
$XLB Materials Sector ETF Chart
When I’m reviewing the price action on a stock, ETF, commodity, etc I like to employ several technical indicators and pattern reviews to manage risk. Today, I highlight the measured move and why XLB may pause here.
As you can see, the rally for XLB from the October low has come in two equal legs that are similar in time and price. We can also see that momentum has been running hot for two months now and at risk for a pause. This tells me that the materials may need some time to consolidate/pullback and refresh before the next setup.
Twitter: @andrewnyquist
The author may have a position in mentioned securities at the time of publication. Any opinions expressed herein are solely those of the author, and do not in any way represent the views or opinions of any other person or entity.


