One stock that has proven to be a powerful leader throughout this bull market is MasterCard (NYSE:MA).
And although the stock is bumping up against major price resistance, MA has been so strong that it’s hard to see it stalling out here.
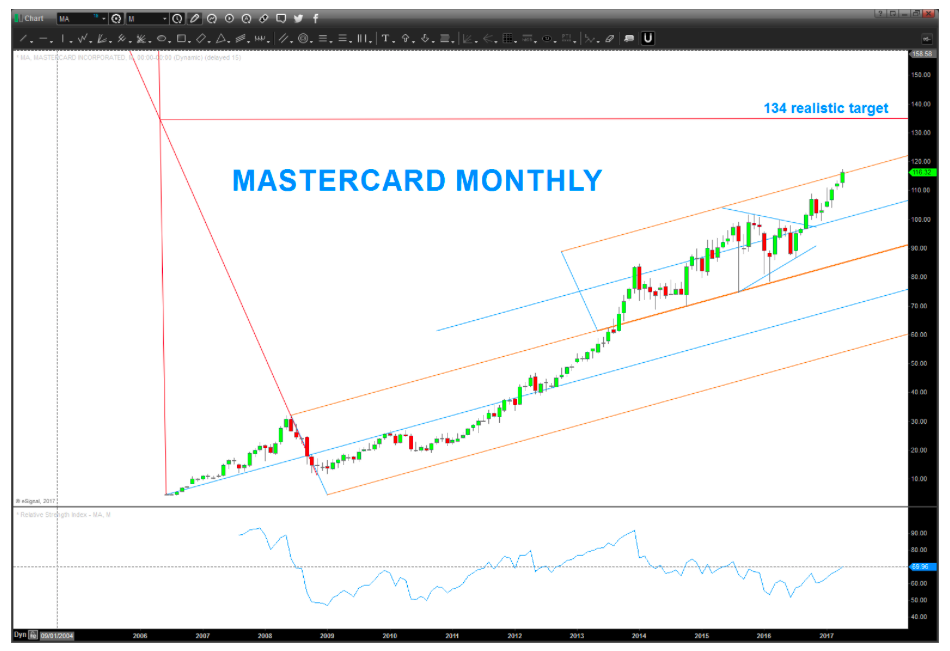
In the charts below, you can see that the first target price area held for a while (2015-2016). But the ensuing consolidation ended up creating a 6-8 month triangle pattern from which the stock exploded higher.
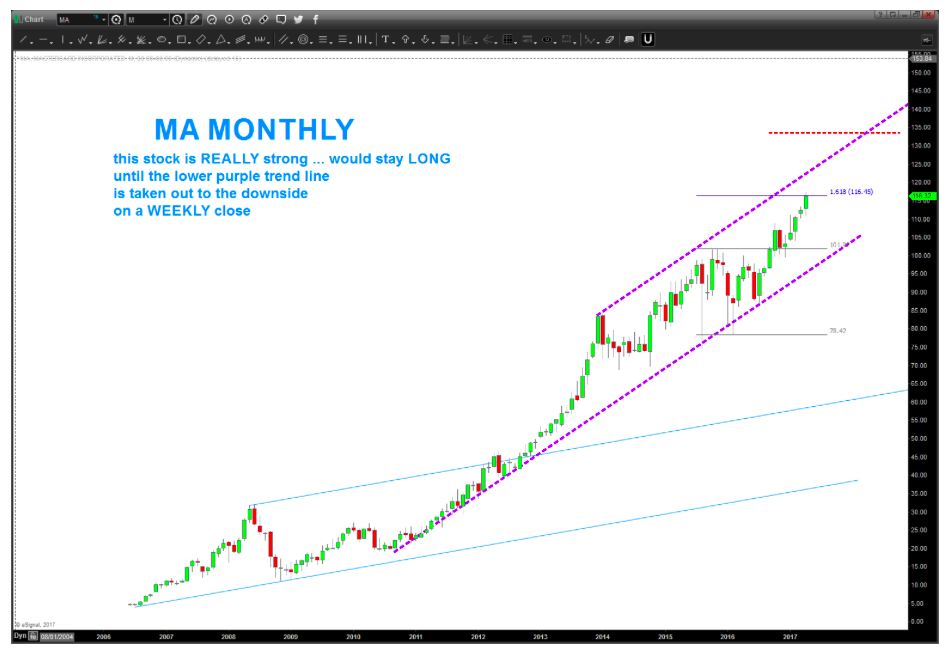
It’s worth noting that triangles are terminal from where they explode (higher or lower)… but this stock is really strong! Do I think MasterCard is still in a 5th wave – YES. And this should elicit some caution and profit taking (especially on moves higher). But, long term investors could keep rolling with this one until the lower purple trend line is broken on a weekly close.
If higher yet, $134 looks like a potential upside target.
MasterCard “Monthly” Bar Charts ($MA)
Thanks for reading and have a great week.
Twitter: @BartsCharts
Author does not have a position in mentioned securities at the time of publication. Any opinions expressed herein are solely those of the author, and do not in any way represent the views or opinions of any other person or entity.


