February was an eventful month, as the stock market selloff seemed to abate somewhat on continued economic stimulus from China and the hope for more stimulus in Europe. In the U.S., many eyes are on the presidential race. And the US presidential race and china economy will continue to affect global markets.
Speaking for myself, I generally become more interested in that race when the race narrows and each side releases its economic plan.
Stocks & Bonds
The S&P 500 halted its slide in February, and finished the month slightly positive. Bonds sold off somewhat, although they have still outperformed stocks as an asset class this year.
By the numbers:
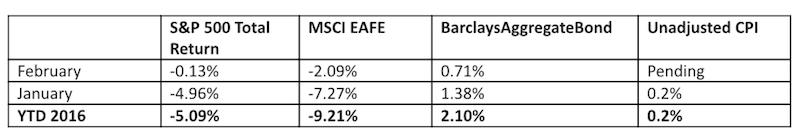
Commodities & Currencies
Although the stock market apparently found reason to rally in February, crude oil was another story. At one point dipping below $30/barrel, the NYMEX contract ended the month at $33.75/barrel, down almost 5% for the month and almost 14% year-to-date. Oil prices have rallied since, but the long decline has taken a toll.
Producers continue to make headlines with rumors of output controls, although so far these rumors seem to be only talk. The oil rig count in the U.S. also continues to decline, but oil output has barely moved downwards, as oil producers have idled less efficient rigs to concentrate output on more efficient locations. A meaningful recovery in crude oil prices seems dependent on either coordinated reduced output, or strong global demand increase. Either of those could happen tomorrow or 5 years from now.
Economy
ISM Manufacturing PMI in February came in at 49.5, an improvement over the prior month but still the 5th straight month of contraction. The non-manufacturing, or services index, is still in expansionary territory at 53.4. More worrisome for American manufacturers is that exports and imports are contracting at an accelerating pace. The Commerce Department released its second estimate of GDP for 2015, and although some additive pieces were changed, the total estimate of economic growth for 2015 stayed at 2.4%. Existing-home sales in January 2016 were 11% higher than in January 2015, and the median sale price increased 8.2% from $197,600 to $213,800. Distressed sales (foreclosures and short-sales) were 9% of the market in January, a slight uptick from the prior month’s 8%.
Summary
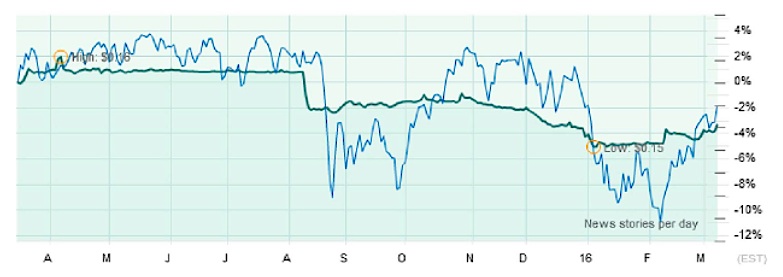
The chart below graphs the Chinese yuan (green line) against the S&P 500 (blue line). I have written previously about the challenges facing the People’s Bank of China (PBOC), the central bank of China, and the China economy. They are spending large sums of their foreign currency reserves to defend the yuan from capital flight. However, some devaluation of the yuan has still been necessary.
In August 2015, the PBOC officially devalued the yuan by a few percent. Days later the S&P 500 was down 10%. The PBOC announced another formal devaluation in January, which saw continued S&P 500 losses. As you can see, upward or downward moves in the Yuan have recently been followed in a very exaggerated fashion by the S&P 500. If the world has a strong yuan, China can buy lots of stuff from other countries, which is good for their economies. If the world suffers from a weak yuan, not only will China buy less stuff from other countries, but Chinese exports will become more competitive placing additional pressure on non-Chinese producers.
So the stock market is rightfully worried about a hard-landing in China, and it seems possible that another devaluation of even a few percentage points could lead to another knee-jerk reaction in U.S. equities. Then again, China has huge foreign currency reserves, and although the odds are against it, they may indeed successfully defend the yuan. The chart below is informational only, I do not advocate market timing. As always, you should consult with your financial professional to ensure that your portfolio is well-designed to withstand any number of changing dynamics, including: 1) A slowdown in the China economy, or 2) A growing economy in China, or 3) The wrong presidential candidate getting your party’s nomination or 4) The right presidential candidate getting your party’s nomination.
Thanks for reading.
This material was prepared by Greg Naylor, and all views within are expressly his. This information should not be construed as investment, tax or legal advice and may not be relied upon for the purpose of avoiding any Federal tax liability. This is not a solicitation or recommendation to purchase or sell any investment or insurance product or service, and should not be relied upon as such. The S&P500, MSCI EAFE and Barclays Aggregate Bond Index are indexes. It is not possible to invest directly in an index. The information is based on sources believed to be reliable, but its accuracy is not guaranteed.
Investing involves risks and investors may incur a profit or a loss. Past performance is not an indication of future results. There is no guarantee that a diversified portfolio will outperform a non-diversified portfolio in any given market environment. No investment strategy can guarantee a profit or protect against loss in periods of declining values. Listed entities are not affiliated.
Data Sources:
- www.standardandpoors.com – S&P 500 information
- www.msci.com – MSCI EAFE information
- www.barcap.com – Barclays Aggregate Bond information
- www.bloomberg.com – U.S. Dollar & commodities performance
- www.realtor.org – Housing market data
- www.bea.gov – GDP numbers
- www.bls.gov – CPI and unemployment numbers
- www.commerce.gov – Consumer spending data
- www.napm.org – PMI numbers
- www.bigcharts.com – NYMEX crude prices, gold and other commodities
- www.federalreserve.org – historical data on 10-year Treasury note
Any opinions expressed herein are solely those of the author, and do not in any way represent the views or opinions of any other person or entity.

 Flirting With Critical Support… Again")


