So as the Greek drama continues to unfold with the looming referendum scheduled for this coming weekend and Greek banks closed until next week, it’s important to get a handle on the markets and where key technical support levels are. Having a plan helps active investors to be more proactive than reactive, and this reduces day to day emotion.
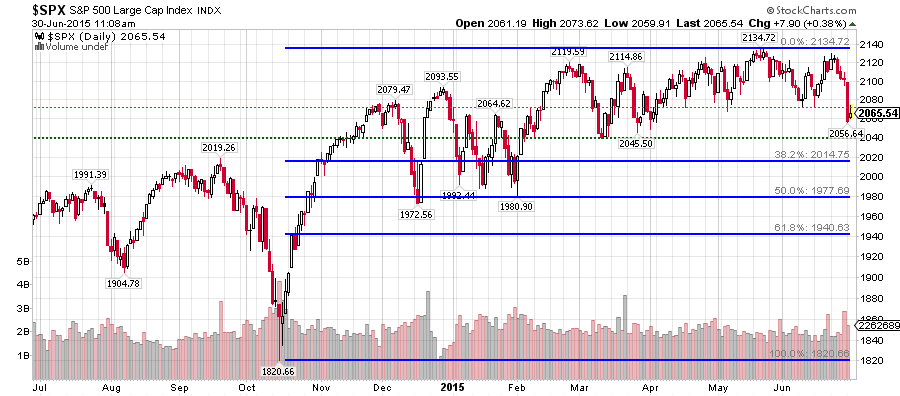
Starting with the S&P 500 (SPX), my first level of technical support resided at 2072… but since this level has been broken, it now will be watched as technical resistance. If the market cannot regain and hold 2072, then two more technical support levels come into play: the 200 day moving average (2053) and 2039 – the later marks the March low and sits just 14 points below the 200 day moving average.
On a closing basis the 200 day moving average becomes one of the more important near-term technical support levels for stocks. Why? Because during only one period since November 2012 has corrective price action taken the S&P 500 below its 200 day moving average (that was October 2014). During that period we saw a swift change in investor sentiment from bullish to bearish and a spike in volatility as represented by the Volatility Index (VIX).
So any move lower in stocks that punctures the 200 dma and breaks below 2039 will likely set in motion more selling. The next level to point out is the 1972-1980 price area (the December and February lows respectively). This area lines up well with what would be a 50% Fibonacci retracement of the rally off the October lows.
If we can see SPX hold and close above 2072 that would be an encouraging sign and show that the market’s resiliency is still alive.
S&P 500 Chart – Fibonacci Retracements & Technical Support Levels
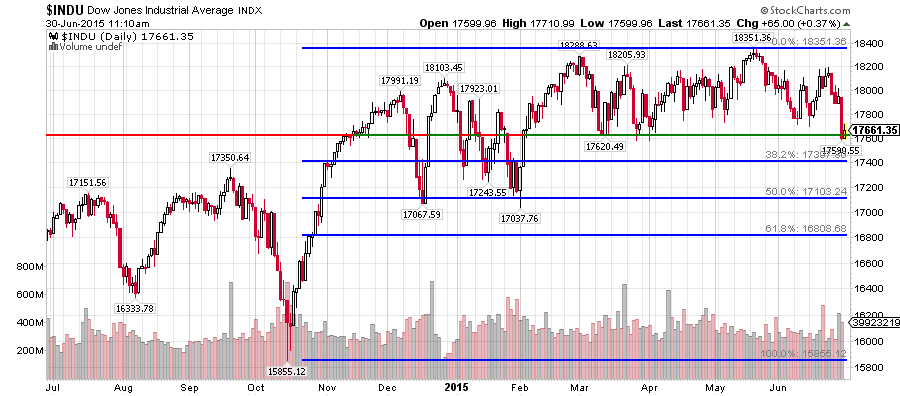
Now let’s take a look at the Dow Jones Industrial Average (INDU) and some technical support levels to watch. The INDU has a lot of similarities to SPX as far as chart structure. I am looking at the March lows around 17600 for support. The next levels of significance are the December and February lows of 17067 and 17037 respectively. This lines up pretty well with a 50% Fibonacci retracement off the October lows. However, a close below 17164 would be concerning as it could very well be signaling a sell according to DOW Theory. More on that in a follow up post. Below is the Dow Jones Industrial Average chart with key Fibonacci retracements and technical support levels.
Dow Jones Industrial Average Chart
Follow a plan and trade with discipline in the days ahead. Thanks for reading.
Twitter: @Snyder_Karl
Any opinions expressed herein are solely those of the author, and do not in any way represent the views or opinions of any other person or entity.


