Stock market bulls continued to struggle mightily to retain any semblance of control over what seems like the growing tide of weakness.
Despite losing Apple (AAPL) to the bears, the S&P 500 actually had a decent rally attempt through the 2110 level on Wednesday. The bears, though, did not have much difficulty extinguishing this effort and the major indices again ended trading on a weak note.
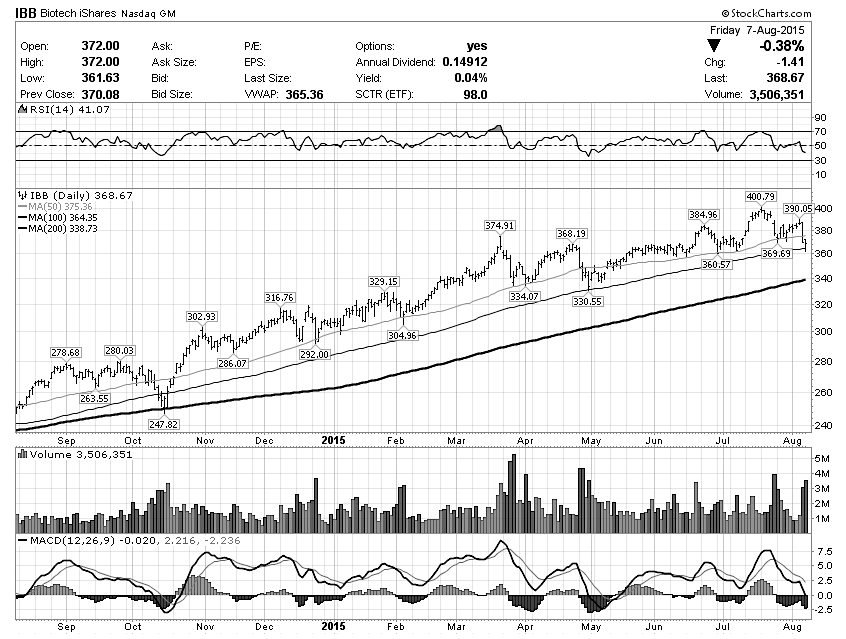
In addition to AAPL breaking down and losing more than -4% last week, the two main biotech ETFs (IBB and XBI) lost -3.6% and -7.10% (!) respectively.
This type of price action is yet another confirmation that the market remains in the risk-off mode. Additionally, signs of the market potentially putting in a more substantive market top are becoming more evident with every passing day.
The following is a review of select stocks, sectors, and indices:
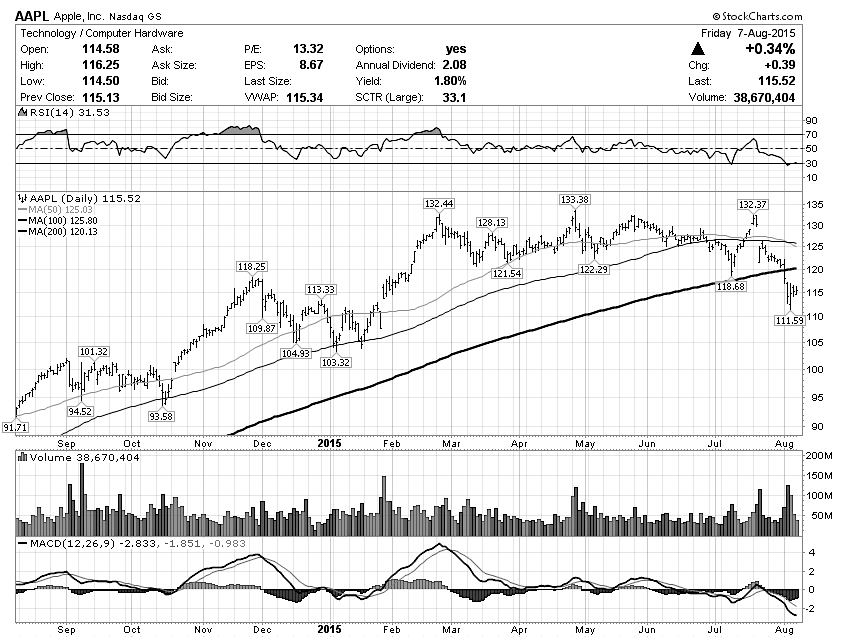
ANOTHER ONE BITES THE DUST – Apple, Inc. (AAPL)
After a six-month sideways consolidation, the bulls were no longer able to defend AAPL and it sliced through the rising 200dma and closed well below it. It remains too soon to declare “the” top primarily because the 200dma is still rising, but it is very hard to interpret last week’s price action as bullish.
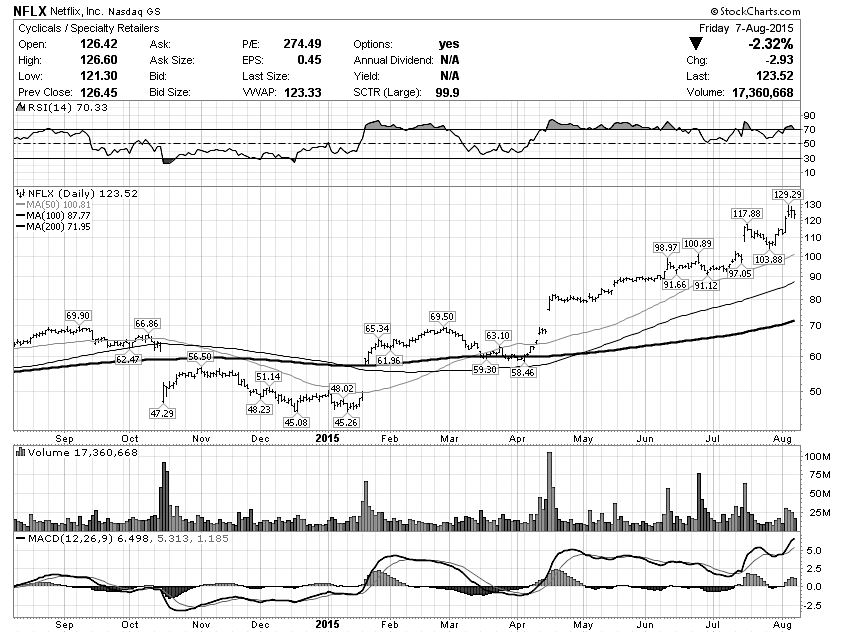
AND THEN THERE WAS ONE – Netflix, Inc. (NFLX)
Seems to be the last remaining momentum holdout still defying gravity. Unless the overall market dynamics change, odds are NFLX’s days are numbered.
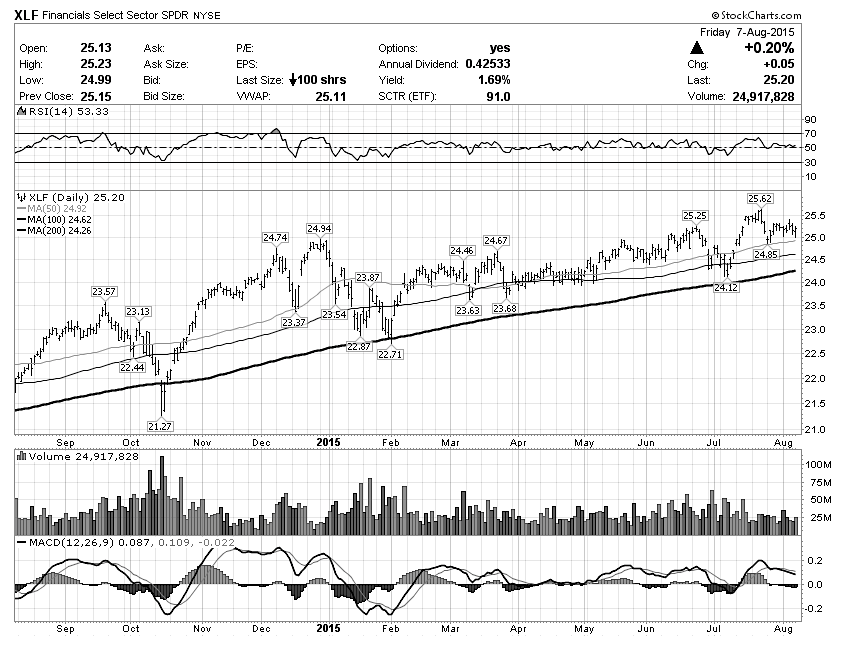
STILL STRONG – Financial Sector (XLF)
Somewhat surprising that the financial sector remains in an uptrend and looks stronger than many of the component stocks. The biggest danger to financials will likely come from the rising bonds (e.g. TLT) and flattening yield curve. If these trends continue XLF will also have a hard time staying in the uptrend.
LEADER NO MORE – Biotech Sector (IBB)
Healthcare and biotech sectors have provided critical leadership for this bull market for a long time. The price action on Thursday and Friday puts the nine-month rising channel in jeopardy as well as carves out a textbook two-month Head and Shoulders market top with the neckline in the 360 area.
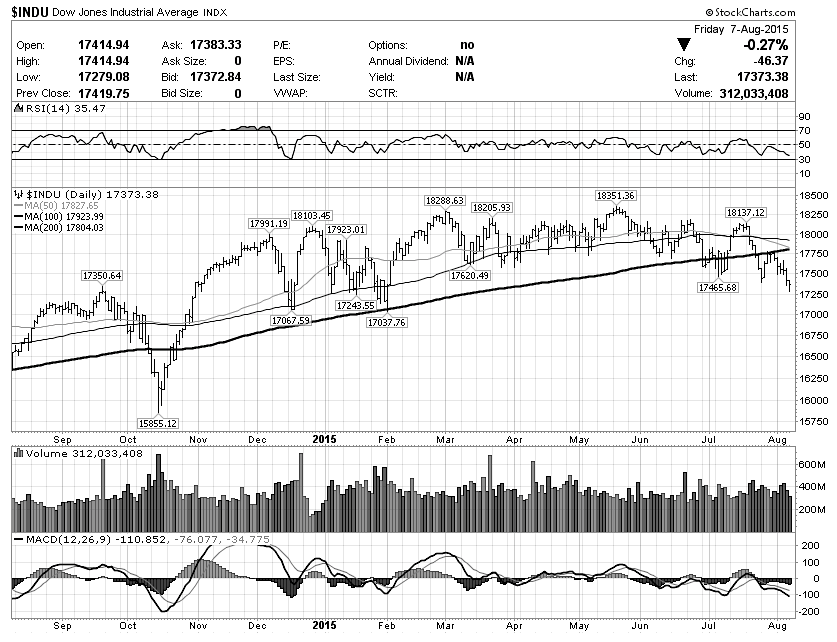
DEATH CROSS – Dow Jones Industrial Average (DJIA)
Appears to be the first major index where the dreaded “Death Cross” (50 day moving average crossing under 200 day moving average) is imminent. This phenomenon is viewed by the media as uber-bearish so expect to see many headlines about it this week. However, it is important to note that a death cross is far from a reliable sign of a market top, especially when the 200dma is still rising.
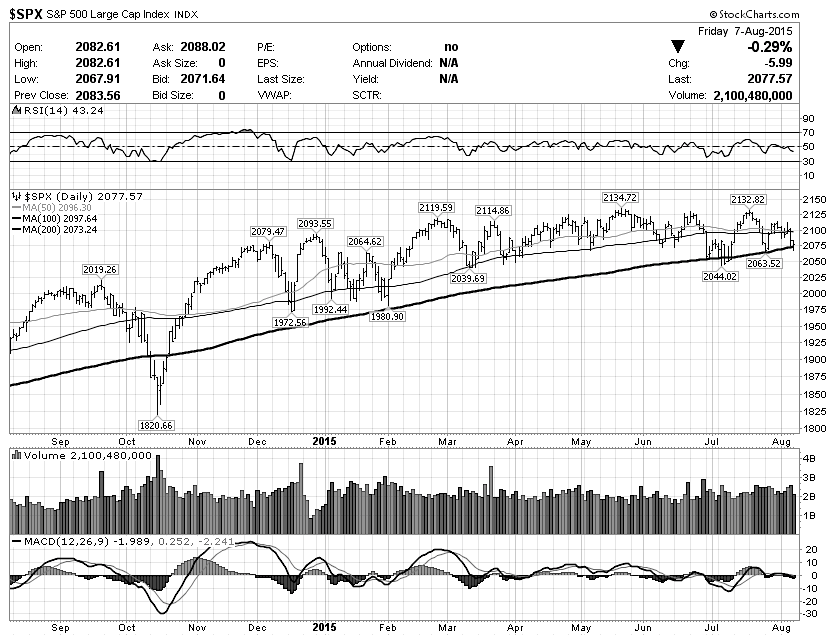
THIRD TIME THE CHARM? – S&P 500 Large Cap Index (SPX)
Friday marked the third time the S&P has tested its 200dma in roughly one month. Bulls managed to defend this level for now, but the odds of a breakdown are increasing with each subsequent test.
Thanks for reading and good luck navigating the market this week.
Twitter: @NoanetTrader
Read more from Drasko’s blog, NoanetTrader.
Any opinions expressed herein are solely those of the author, and do not in any way represent the views or opinions of any other person or entity.


